Brent: Global Overview
This week began with several positive news which made investors feel confident about future global economic recovery.
China's apparent success in fighting the Delta variant of the coronavirus, with no cases of locally transmitted infections in the latest data. Moreover, on Monday the U.S. Food and Drug Administration issued full approval for the Pfizer/BioNTech two-dose vaccine. The World Health Organization reports the number of new Covid-19 cases "seems to be plateauing" after increasing for nearly two months.
Brent has always been the driver of economic recovery and development. In this article, we will discuss why the end of the pandemic is equal to the beginning of the new raw material cycle.
Let’s check the global Brent oil futures chart!
Brent futures, monthly chart
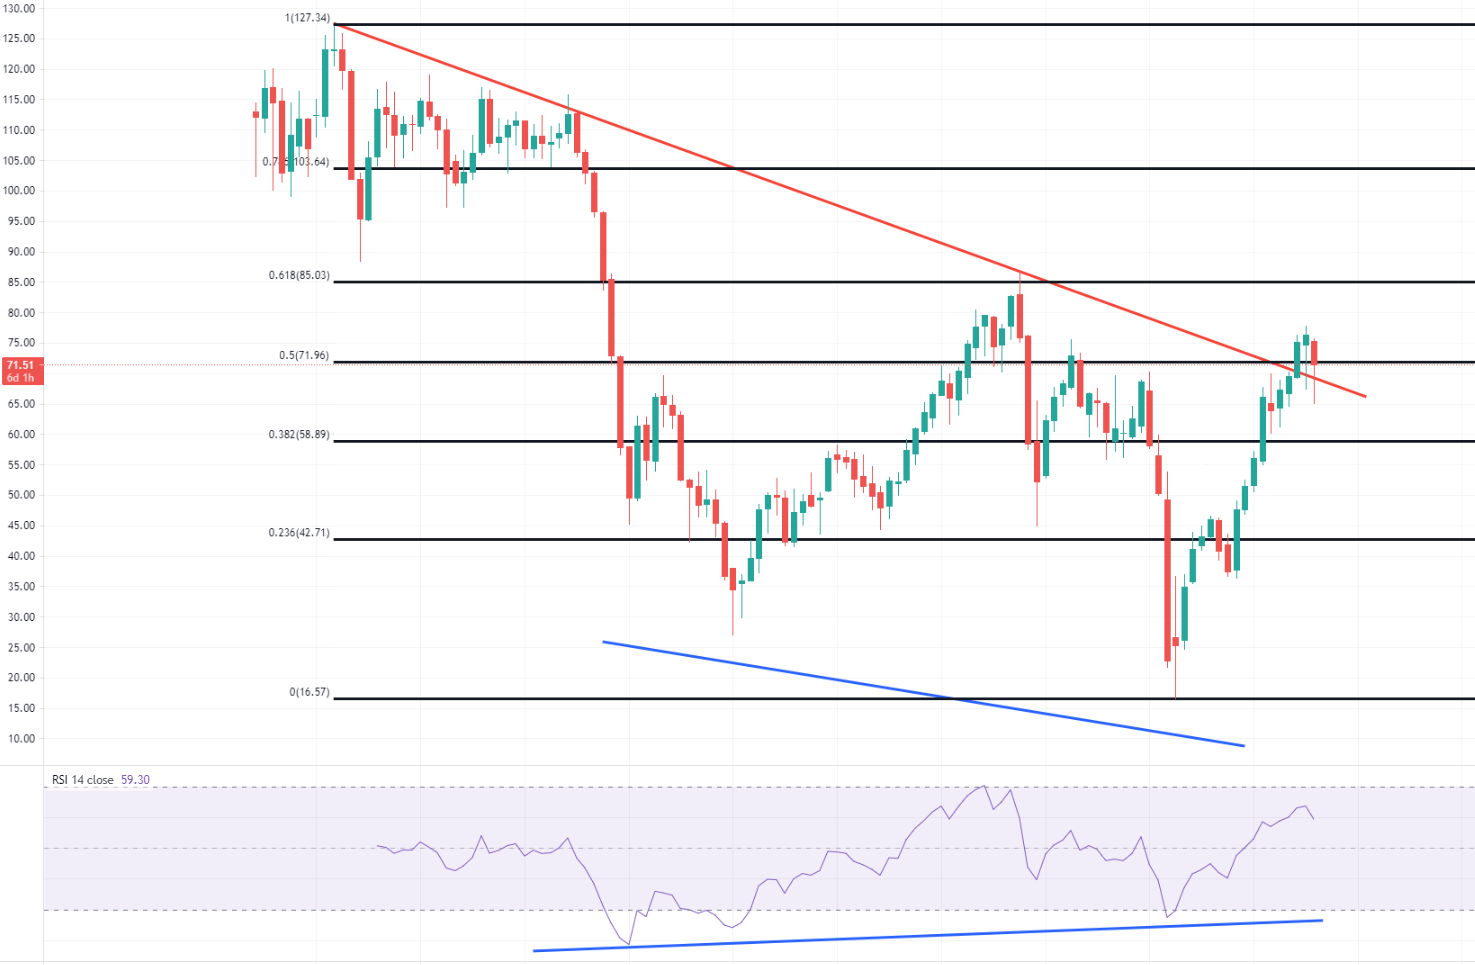
Source: tradingview.com
According to Tradingview data, the Brent price might get pumped during an upcoming month. There are three reasons for that:
- Brent price broke and retested the global downtrend line which has been forming since the beginning of 2012.
- The bullish divergence occurred on the RSI.
- Two last monthly candles have long bottom shadows (it will be a great signal if the August price closes above $72, which is 50 Fibonacci level).
Short term period:
XBR/USD, 1H chart
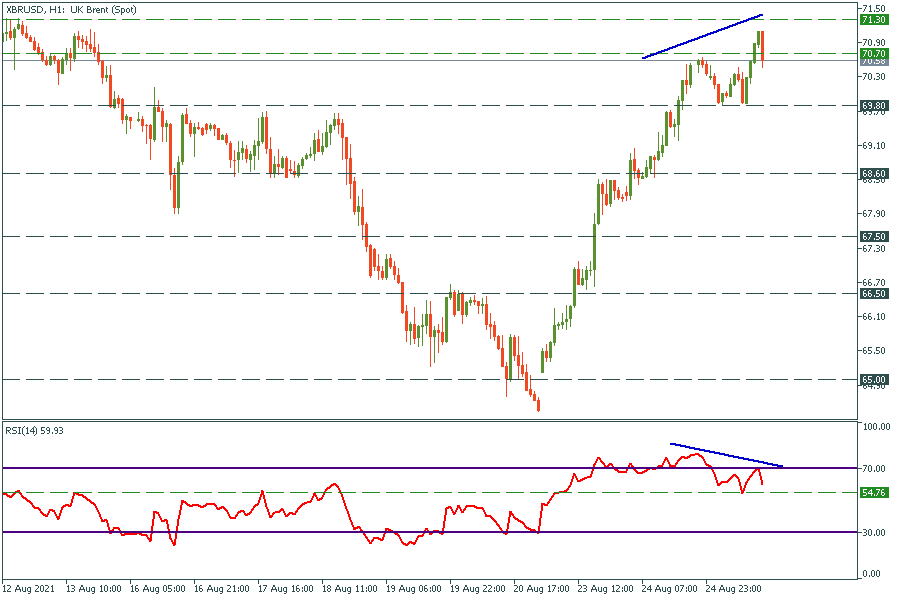
On the 1 hour chart, the bearish divergence occurred. The closest support level is $69.8. If the price breaks through, it will drop to $68.6. Otherwise, we might see the price reaches $71.3 and the main August target of $72 shortly.