GBP/CHF: testing the resistance
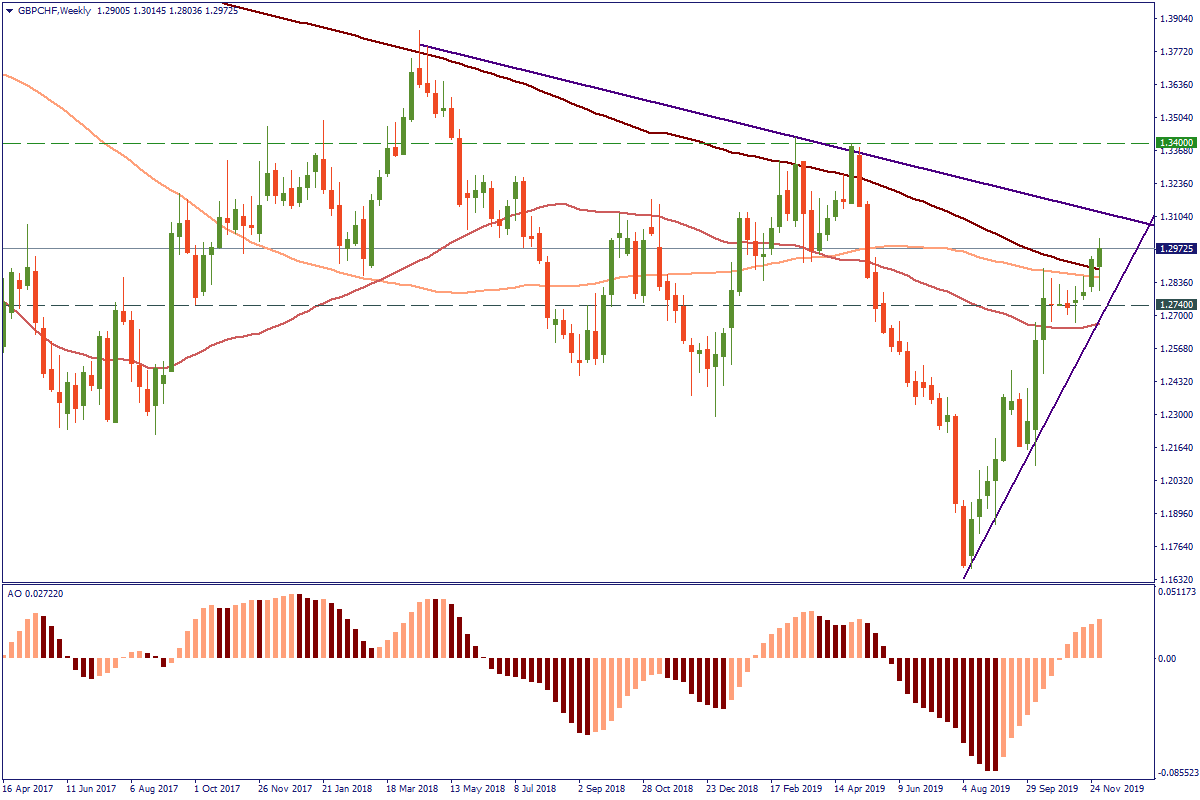
On the weekly chart of GBPCHF, we see two spikes in the course of a larger falling trend of the price. These took place in April 2018 and March-May 2019. Both times the price either traded at the level of the 200-period Moving Average but eventually did not fix the breakthrough, or actually broke it, but then went into decline the next week. We are observing a similar picture now – the price is testing the 200-period MA once again.
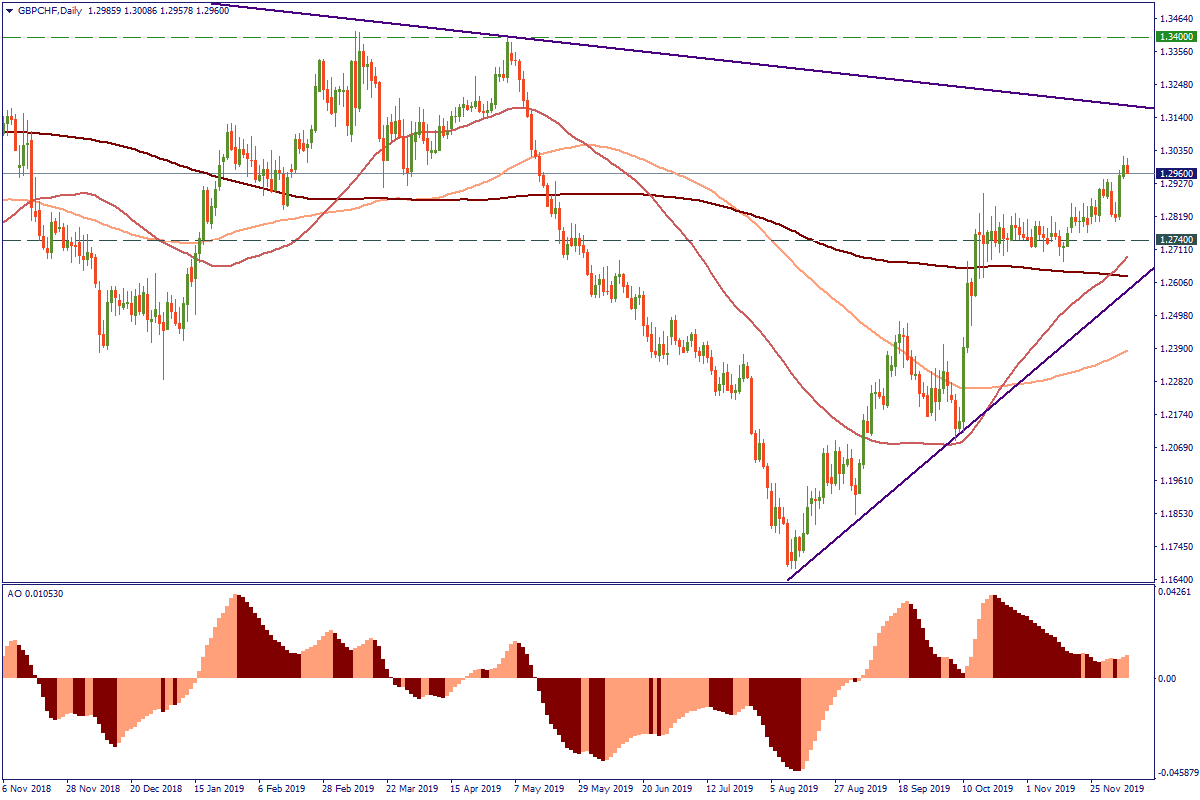
The daily chart shows in more detail the collision course of the rising trend in place since August (lower trend line) and the larger falling trend since April 2018 (upper trend line). If the price behaves the same way it did before, it will come closer to the upper line and bounce back down. For this scenario, the first big support on the way would be 1.2740 – the currency pair has been consolidating and moving sideways along this level during the entire month from the middle of October until the middle of November. On the other hand, if the market intends to set an entirely new large trend, then the price should be able to break the upper trend line and aim at 1.3400 as the first bullish threshold.