Gold exploded after FOMC meeting!
Baca artikel ini di laman web FBS
As we discussed in the previous article devoted to gold, the price is growing extremely fast after a dovish FOMC’s statement.
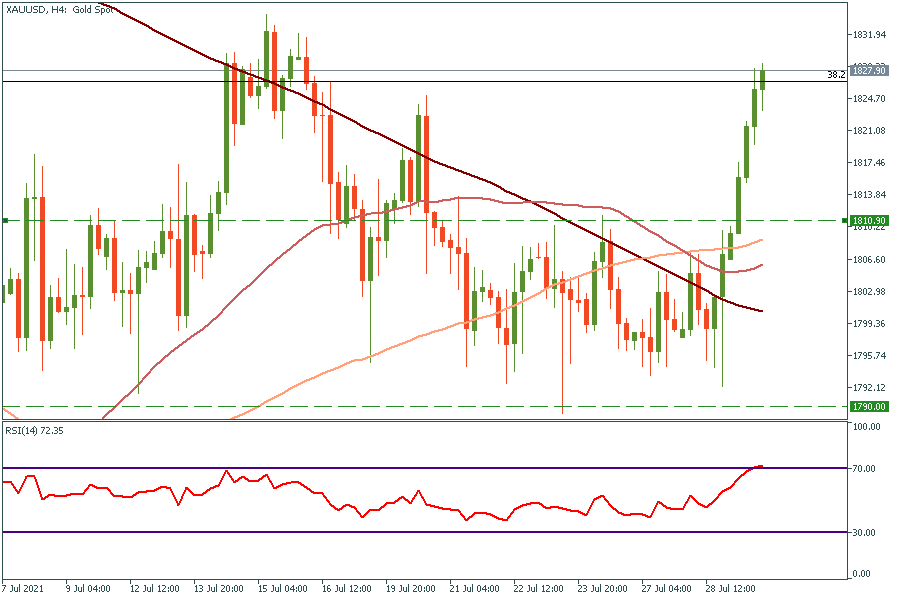
4H Chart
Let discuss perspectives of yellow metal in a short-term period!
Daily chart
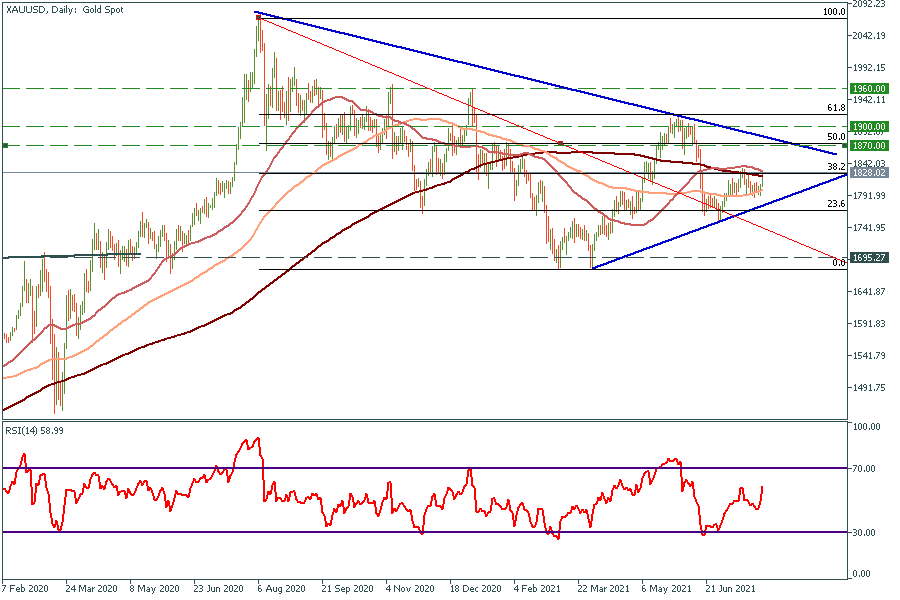
On the 4H chart, the symmetrical triangle has occurred. According to the RSI, oscillator bulls have enough power to push the price higher. Right now we need to wait for a breakout since gold is trading under our first target from the previous article, which is strong resistance. As soon as the price breaks and sticks above the $1830, which is the cross point of 38.2 Fibonacci level and 50-day moving average, it will fly to $1870 shortly.
On the flip side, it might slide down to the 50-period average at $1810.