Gold's breakdown: what's next?
Baca artikel ini di laman web FBS
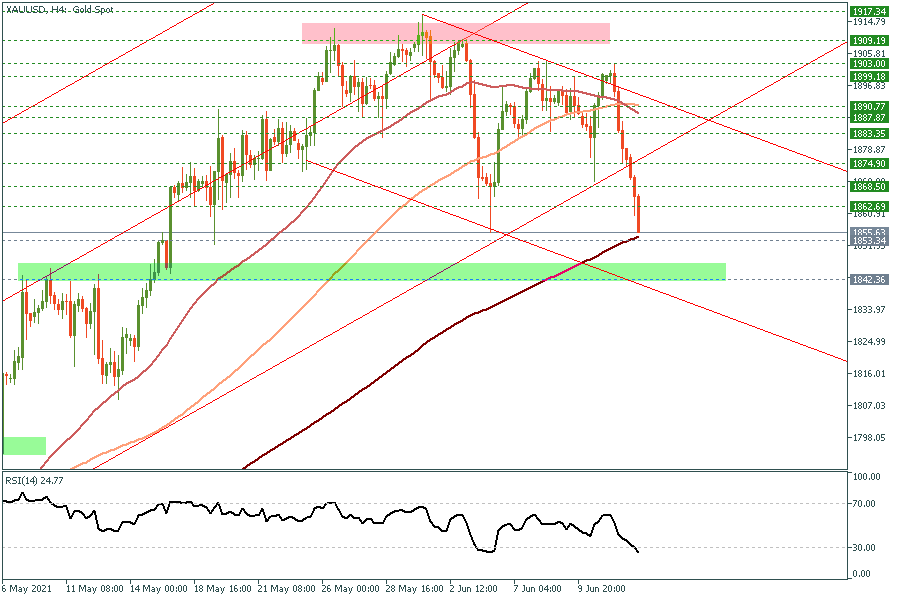
4H Chart
Daily Chart
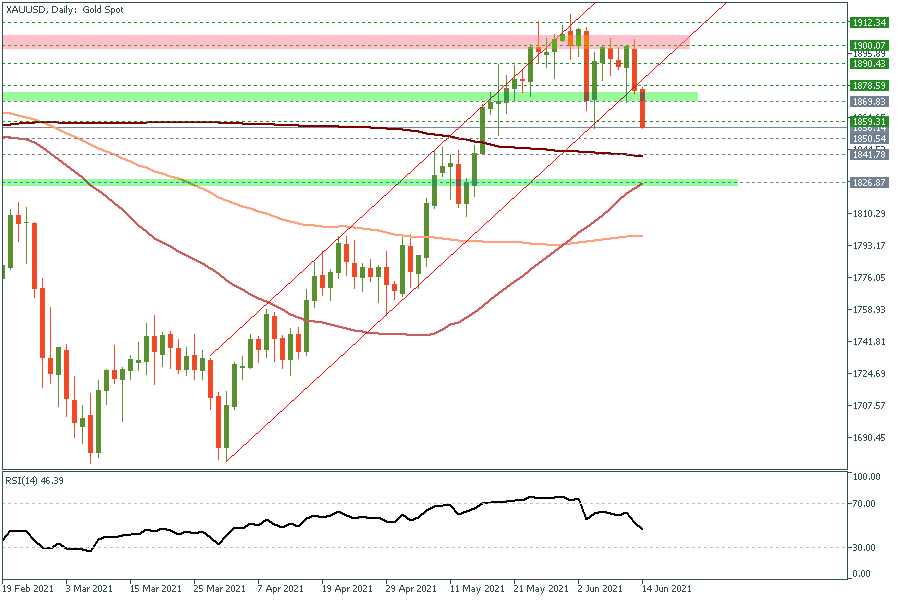
Gold prices tumbled on Friday and at beginning of the Asian session today, reaching as low as $1854/Oz, breaking through its upside channel on the daily chart, while the technical indicators are now clearly bearish, which confirms our short-term retracement outlook mentioned before since gold was trading above $1910. In the meantime, the key support for this week stands at $1840 which represents the 200-day MA, where gold is likely to show some stabilization, while we maintain our medium-term long positions that were issued back in April at $1710 and $1725 unchanged with a Stop Loss at $1730/Oz for now.
| S3 | S2 | S1 | Pivot | R1 | R2 | R3 |
| 1828.00 | 1856.53 | 1867.03 | 1885.06 | 1895.56 | 1913.59 | 1942.12 |