NZD/CAD has been moving up
Baca artikel ini di laman web FBS
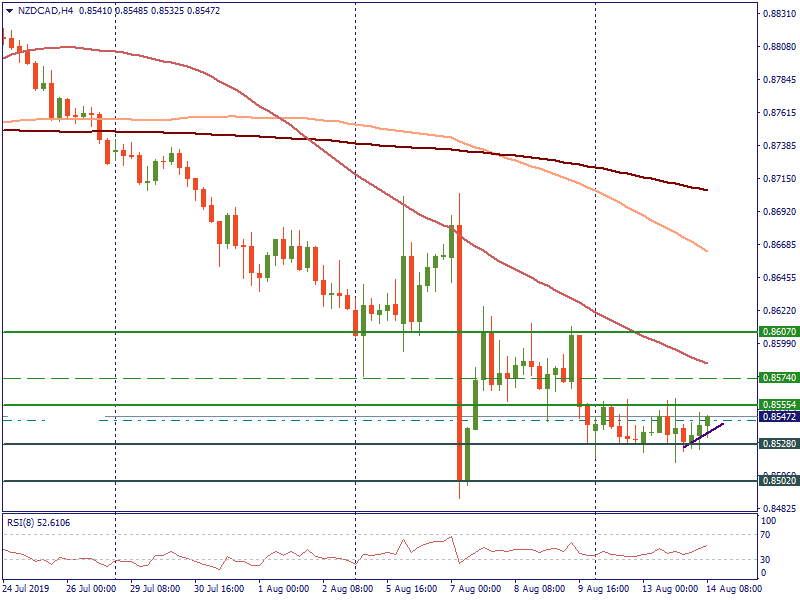
On the daily chart of NZDCAD, the RSI indicator has been trying to leave the oversold area. Moreover, we see that the pair has been forming candlesticks with long shadows that may be considered as an additional signal of the possible reversal. If we take a look at H4, we will see that the pair has been moving towards the first target at 0.8555. The next long may be expected after the pair touches 0.8574. The target will lie at 0.8607.
If the pair slides, the first support is located at 0.8528. The next level for short is at 0.8511. In the case of the weak NZD, the pair will continue suffering to 0.8502.