OIL: a detailed short-term outlook
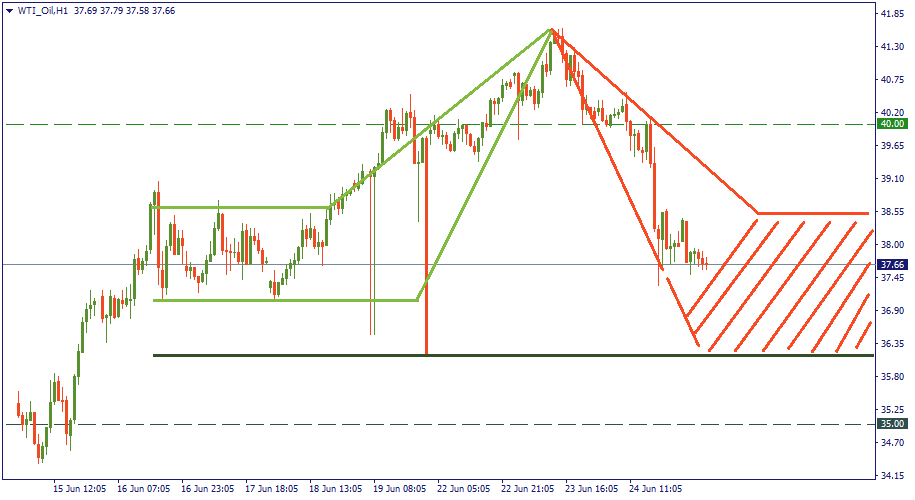
On Wednesday, when the WTI oil price stopped at $40 we advised that it would go further down to the area of $37.5. Eventually, it happened exactly as foreseen – the price is currently at $37.5 although we did not expect it to go down as fast as it did. Now, it makes sense to a closer technical look to it to properly prepare for possible outcomes.
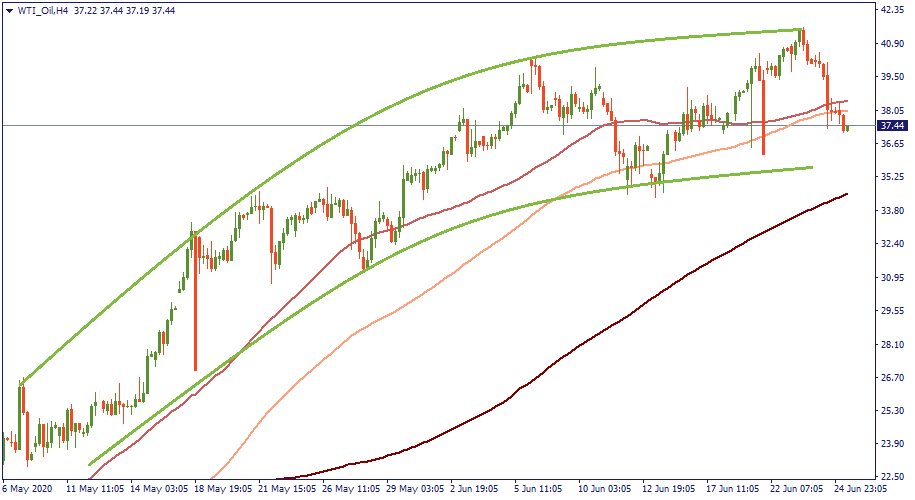
In the midterm, we see that the pace of recovery that WTI was at during May got slower. Since the beginning of June, the price is barely climbing upwards – that is visible with the Moving Averages as well. Trading way above the 50-MA in May, oil more frequently goes downwards to the area where 50-MA and 100-MA overlap – currently at 38.0. It doesn’t suggest a fundamental trend change, though, – just the fact that it will definitely take longer to get from $40 to $50 than what it took to get from $30 to $40.
In the short term, we see that the recently left pear above $40 makes a tip of a pyramid-like formation based somewhere at $36. Why exactly $36? On June 19 and 22, the price dropped to this level. Although that was really short-term and did stop it from going upwards eventually, plunges like this don’t happen for no reason. Downside definitely has heavy gravity, and WTI price will be under its influence at least until the second-wave virus fears are gone. Therefore, we are expecting the red-marked area to be an expected zone of movement for the oil price in the short-term – that is, at and below $38.