Oil rally takes breath
Oil prices have been climbing up for a long time. What have stopped them?
Supply-demand question
First of all, prices fell on Wednesday after the API reported a surprisingly large crude build. It was reported an 8.7-million-barrel build, while analysts expected a 1.9-million-barrel draw. On Thursday US commercial crude oil inventories rose by 7.9 million barrels from the previous week. However, fuel demand remained weak. That disappointed many bullish investors as they hoped the oil demand would increase in the USA due to the Memorial Day weekend and easing lockdowns all over the world, but it didn’t improve as much as they thought. There are many doubts when the oil demand will return to its pre-crisis levels. Things are not so bad. For instance, Morgan Stanley reported that the demand will significantly rebound by the fourth quarter this year.
Overall market sentiment
Oil prices are really sensitive to the whole market mood. Today investors are a bit confused as US-China relationship got worse ahead of Donald Trump’s press conference on Chinese actions. China imposed a security law in Hong Kong and, by that, threatened its autonomy, freedom and placed it at risk to lose its title of a financial hub. As a result, oil prices have started to ease off today.
OPEC+ issue
According to OPEC+ agreement, all its members will cut the oil supply during the whole June. Saudi Arabia and some other OPEC members insist on extending output cuts of 9.7-million barrels per day beyond June. That's all well and good, but... Russia may reject this proposal as Russia’s largest oil producer, Rosneft, is struggling to supply its long-term buyers with crude oil. Also, Russian firms argued that these oil supply cuts just support the US shale production with higher oil prices, what gives the US oil producers a larger piece of the global oil cake at the expense of Russia and its OPEC allies. But, maybe OPEC will manage to get a Russian support.
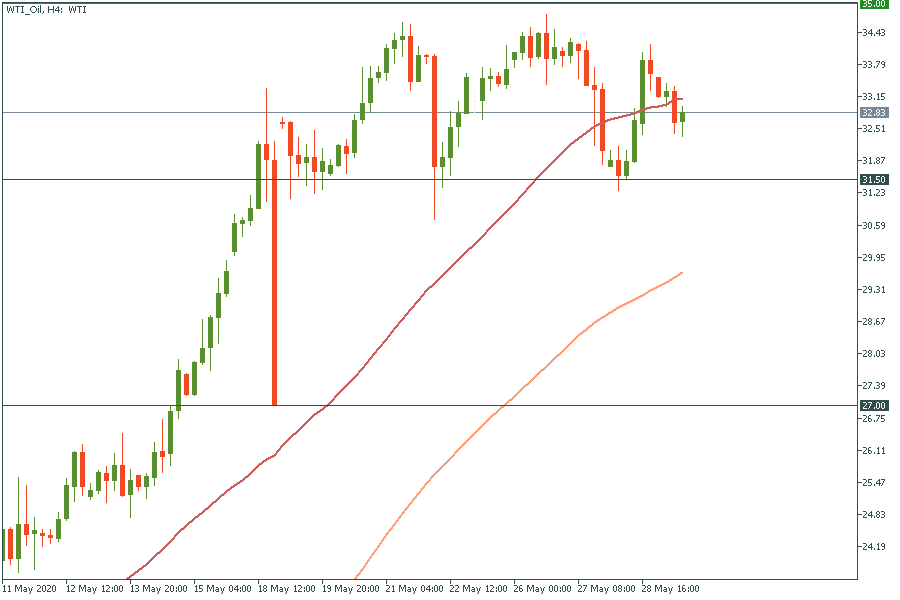
Technical outlook
Let’s look at the WTI oil chart. The price has been increasing since April 28. Then the price entered the horizontal corridor on May 18. From that moment, it has been trading in a range from 31.5 to 35. If the price crosses the support line at 31.5, it may dip down to 27. Resistance levels are 35 and 37.5.
To trade WTI with FBS you need to choose WTI-20N.