USD/CAD: Canadian positive data vs US negative data
The Canadian employment change has been released at the same time with the US PPI. The best opportunity of this week for traders!
What happened?
- 952 900 Canadians have been hired during June. Analysts expected that only 700 000 people would find jobs. This data gave a good sign that the Canadian labor market is gradually recovering. In comparison, the previous report showed that 289 600 people were employed during May. However, the Canadian unemployment rate came worse than expected: 12.3%, that was more by 0.3% than the forecast.
- Two types of Producer Price Indexes (PPI) were released: the Core PPI and the PPI. The Core PPI shows the change in the price of finished goods and services sold by producers, excluding food and energy. Unlike it, the PPI includes food and energy. Both of them turned out worse than analysts anticipated. The results you can see below.
Actual Forecast Previous
Core PPI -0.3% 0.1 -0.1%
PPI -0.2% 0.4% 0.4%
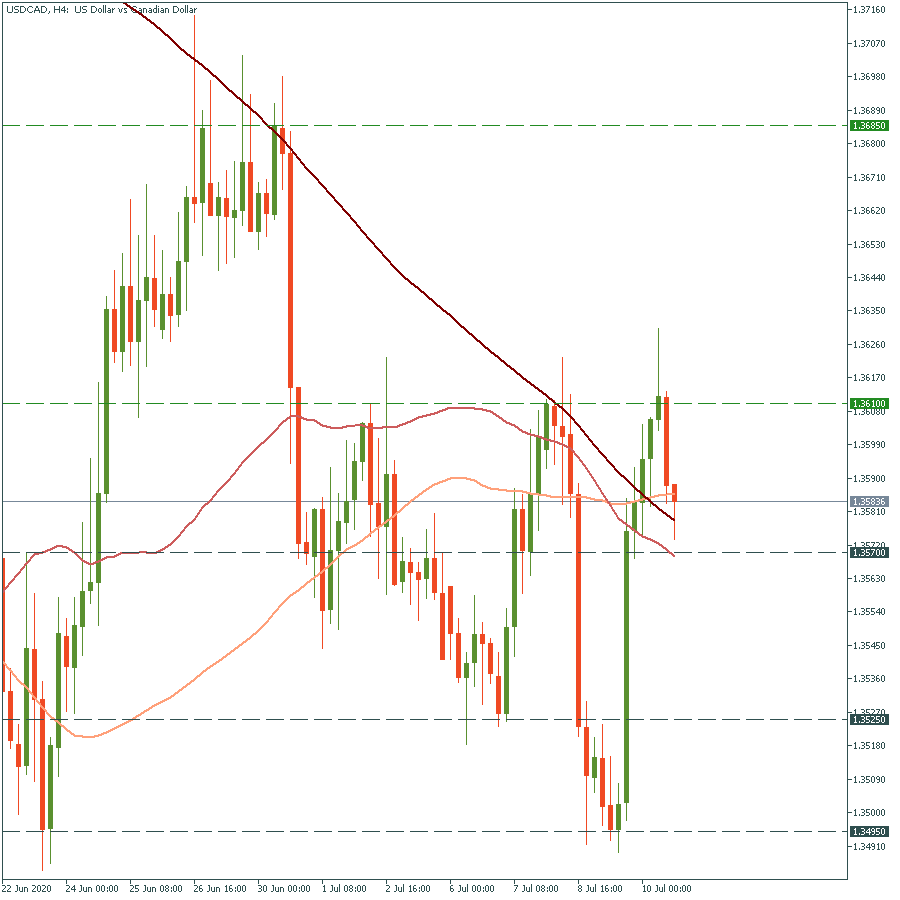
How to trade USD/CAD?
Opportunities like this come along quite rarely. The Canadian dollar got two tailwinds at the same time. As a result, USD/CAD started moving down. Based on fundamental factors we can assume that the pair should go down further. It has already broken through two moving averages, but there is one left – the 50-period moving average at 1.3570. If the price crosses it, it may plummet to the next support level at 1.3525, which it has touched several times already. The move below this level will push the price to the low of June 9 at 1.3375. Resistance levels are at 1.3610 and 1.3685.