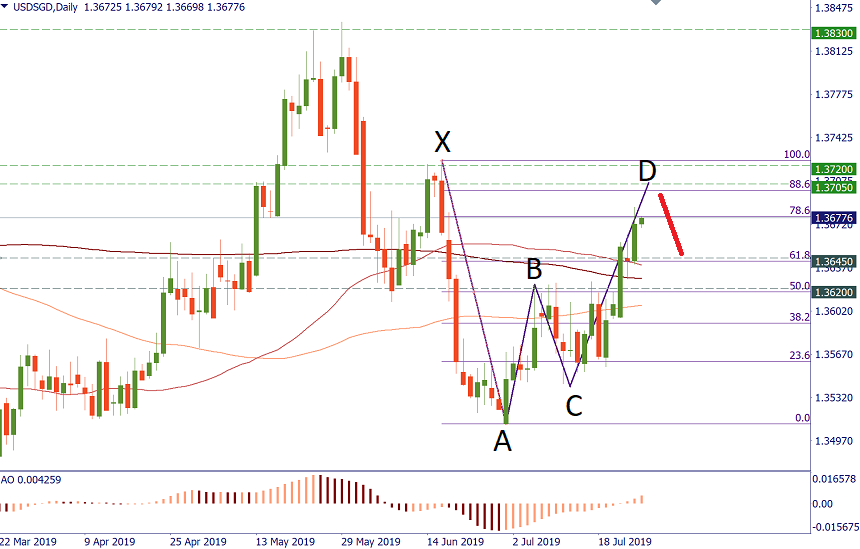
USD/SGD: a harmonic pattern
Baca artikel ini di laman web FBS
Trade idea
SELL 1.3700; TP1 1.3645; TP2 1.3620; SL 1.3720
The chart of USD/SGD offers a look at what seems like a harmonic “Bat” pattern. The pair is currently forming point D. It should be located somewhere around 1.3705 (88.6% Fibo of AB). In addition, there’s a 200-week MA in this area. This means that USD/SGD will likely run into resistance and turn down allowing to make a bearish trade.