Apakah wujud gaya hidup pedagang intrahari yang berjaya yang mudah disesuaikan dengan pedagang Forex, saham, dan lain-lain?
Selamat datang ke dunia seorang pedagang FBS, di mana beliau berjaya mengamalkan rutin perdagangan hariannya dengan konsisten. Dengan peranti mudah alih di tangan, alat-alat penting perdagangan, dan komitmen yang teguh dalam mendisiplinkan diri, beliau mencapai hasil yang mengagumkan dari bulan ke bulan. November ini, beliau sudah menutup 21 pesanan dengan keuntungan bersih hampir $9000.
Dalam artikel ini, kita akan mempelajari apakah langkah-langkah, petunjuk, dan nasihat beliau untuk berdagang di pasaran. Sama ada anda seorang pedagang saham atau peminat Forex, tips beliau mengenai gaya hidup pedagang harian pasti berguna untuk anda.
Potret pedagang
Nama: Ahmad
Pekerjaan: freelance motion designer
Pengalaman berdagang: 5 tahun
Gaya pedagangan: separuh masa
Instrumen kegemaran: GBPUSD
Helo, traders! Saya Ahmad. Sebagai seorang trader yang berpengalaman, saya sangat percaya bahawa disiplin adalah kunci kepada keberkesanan, terutamanya dalam dunia perdagangan. Biar saya tunjukkan kepada anda apa yang saya lakukan untuk meraih manfaat semaksimumnya daripada perdagangan intrahari di pasaran forex.
Jadual saya
Rutin pagi
Saya biasanya berdagang apabila pasaran London dibuka. Ia pada jam 3:00 petang. waktu tempatan saya, jadi saya ada banyak masa untuk bersiap sedia untuk bekerja dan menyediakan strategi untuk berdagang.
7:00 pagi Saya mulakan hari saya dengan membuat sarapan, mengenakan pakaian, dan malah bersenam jika mood saya baik. Kemudian, saya merancang hari saya: bekerja, membeli-belah, dan berdagang.
8:00 pagi Saya membaca berita ekonomi sambil minum kopi. Saya cuba untuk tidak abaikan bahagian ini kerana penting untuk menyemak situasi pasaran, meninjau peluang, dan merancang strategi saya untuk kemudian.
9:00 pagi Saya mula mengusahakan projek saya – saya tidak membuang masa untuk perkara-perkara yang melekakan sehingga pasaran dibuka.
Rutin petang
2:00 petang Waktu untuk makan tengah hari! Saya biasanya makan dengan tergesa-gesa. Itu tidak bagus untuk kesihatan, tetapi saya mahu memberi tumpuan kepada perdagangan secepat mungkin.
2:30 petang Saya merancang strategi saya dan menyesuaikannya sekiranya ada acara ekonomi dijadualkan pada masa terdekat.
3:00 petang Sesi perdagangan London bermula. Saya mencari peluang dan membuka pesanan. Apabila saya sudah membukanya, saya kembali mengerjakan projek saya dan memeriksa urusniaga-urusniaga saya di telefon bimbit saya dari semasa ke semasa.
Rutin malam
6:00 petang Saya menyelesaikan projek kerja saya, menyediakan makan malam, dan melakukan beberapa hobi saya. Menjaga keseimbangan antara kehidupan dan kerja adalah penting bagi saya.
8:30 malam Saya selesai berdagang. Kini tiba masanya untuk menganalisis semua urusniaga perdagangan saya, mencatat nota dalam jurnal perdagangan saya, dan merenungkan prestasi hari saya.
9:00 malam Sekarang tibalah masa untuk berehat.
Kemudian, saya cuba tidur sekurang-kurangnya 7 jam untuk berehat dengan baik. Saya menjaga kesejahteraan jasmani dan rohani saya dengan serius.
Cara saya melaksanakan perdagangan saya
Persiapan saya
Saya menjalankan dua jenis analisis:
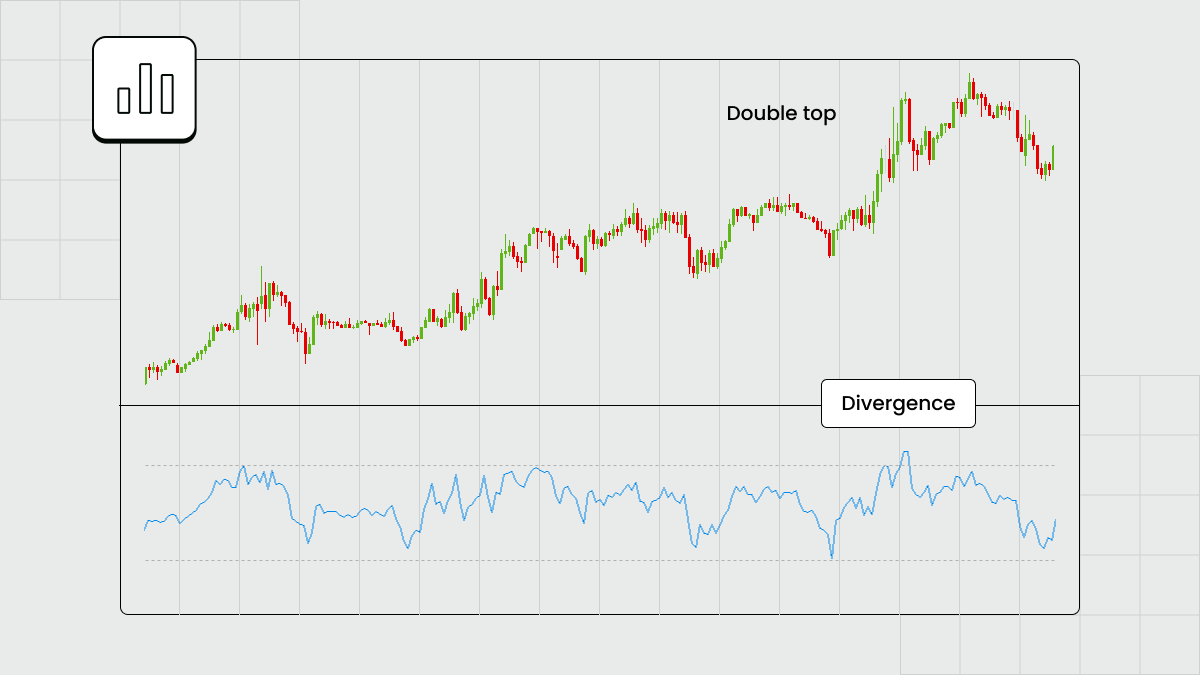
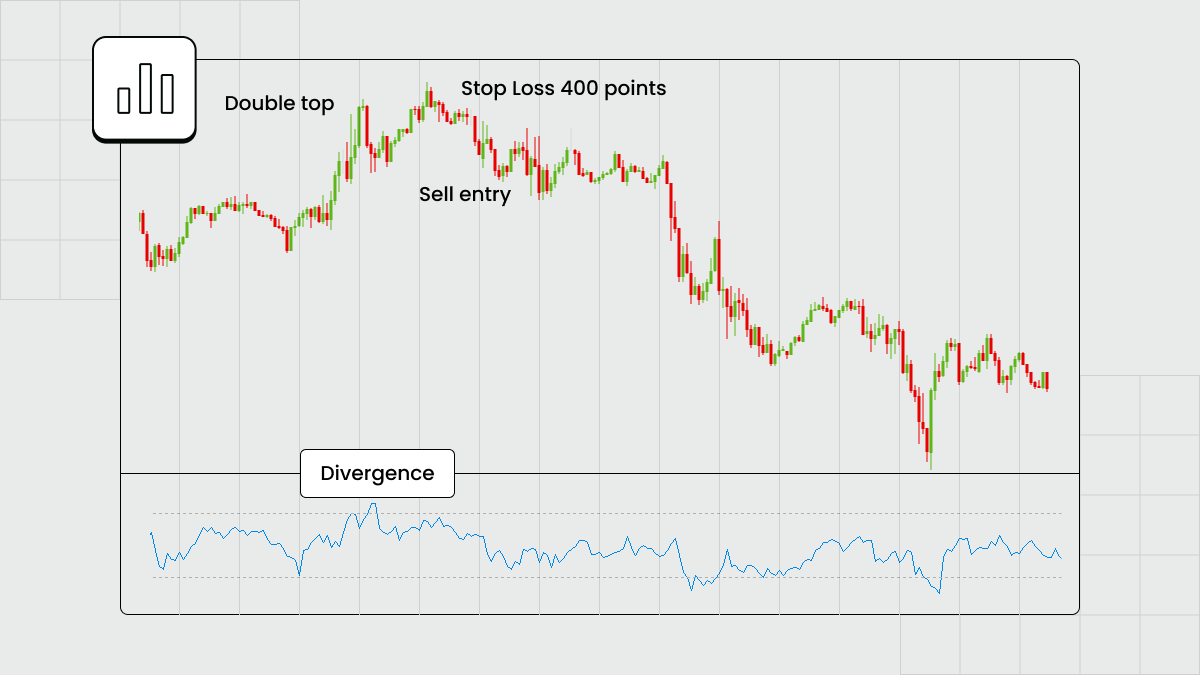
Analisis teknikal untuk meramalkan pergerakan harga masa depan dengan menggunakan indikator teknikal, seperti purata bergerak (moving average) dan RSI, dan mengenal pasti pola trend, seperti head and shoulder atau double tops.
Analisis fundamental untuk mengkaji pasaran dan memberi tumpuan pada faktor-faktor ekonomi, kewangan, dan geopolitik yang boleh memberi kesan kepada pergerakan harga.
Contoh setup perdagangan saya.
Pada waktu pagi, lama sebelum saya mula berurusniaga, saya menganalisis rangka masa harian untuk memahami arah harga, menyemak rangka masa 4 jam untuk memastikan strategi saya betul, dan rangka masa 1 jam untuk membuka posisi.
Setiap pedagang mempunyai strategi dan kecenderungan mereka sendiri berkenaan pembukaan posisi. Tetapi bagi saya, adalah penting untuk membaca carta dan mengenal pasti pola trend terlebih dahulu.
Setup saya
Untuk setup perdagangan yang berkesan, saya mengikuti langkah-langkah ini:
Kira saiz posisi.
Kenal pasti nisbah ganjaran-risiko, dan saya memilih nisbah klasik 1:3.
Set aras renti rugi (stop loss) dan ambilan untung (take profit) berdasarkan nisbah risiko-ganjaran saya.
Pelaksanaan saya
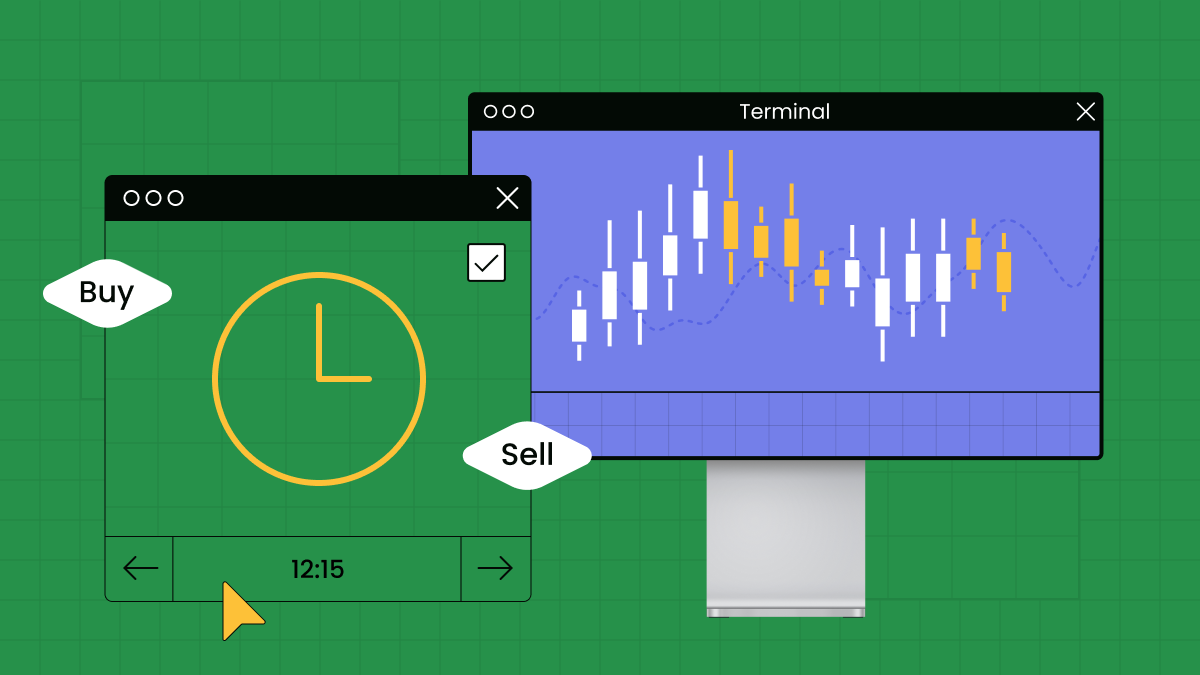
Saya membuka urusniaga saya sama ada di komputer atau telefon bimbit. Walau bagaimanapun, saya lebih suka menggunakan aplikasi perdagangan mudah alih untuk membuat pesanan di mana sahaja. Apabila semuanya sudah diset dan selesai, saya memantau kemajuan dari semasa ke semasa, tetapi saya cuba berpegang pada tetapan, strategi dan analisis saya. Penggunaan pesanan aras renti rugi dan ambilan untung adalah satu kemestian bagi saya.
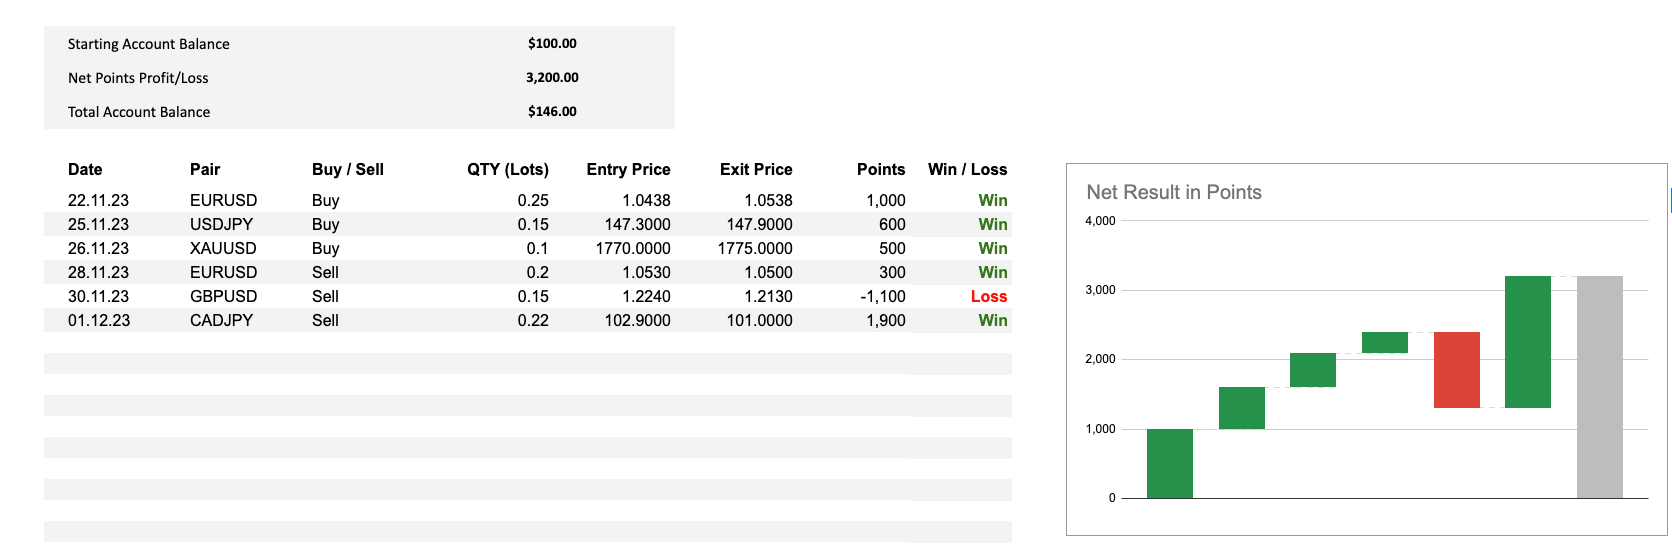
Selepas pesanan saya dilaksanakan, saya catatkan setiap urusniaga dalam jurnal perdagangan saya dan menganalisis kesilapan dan pencapaian.
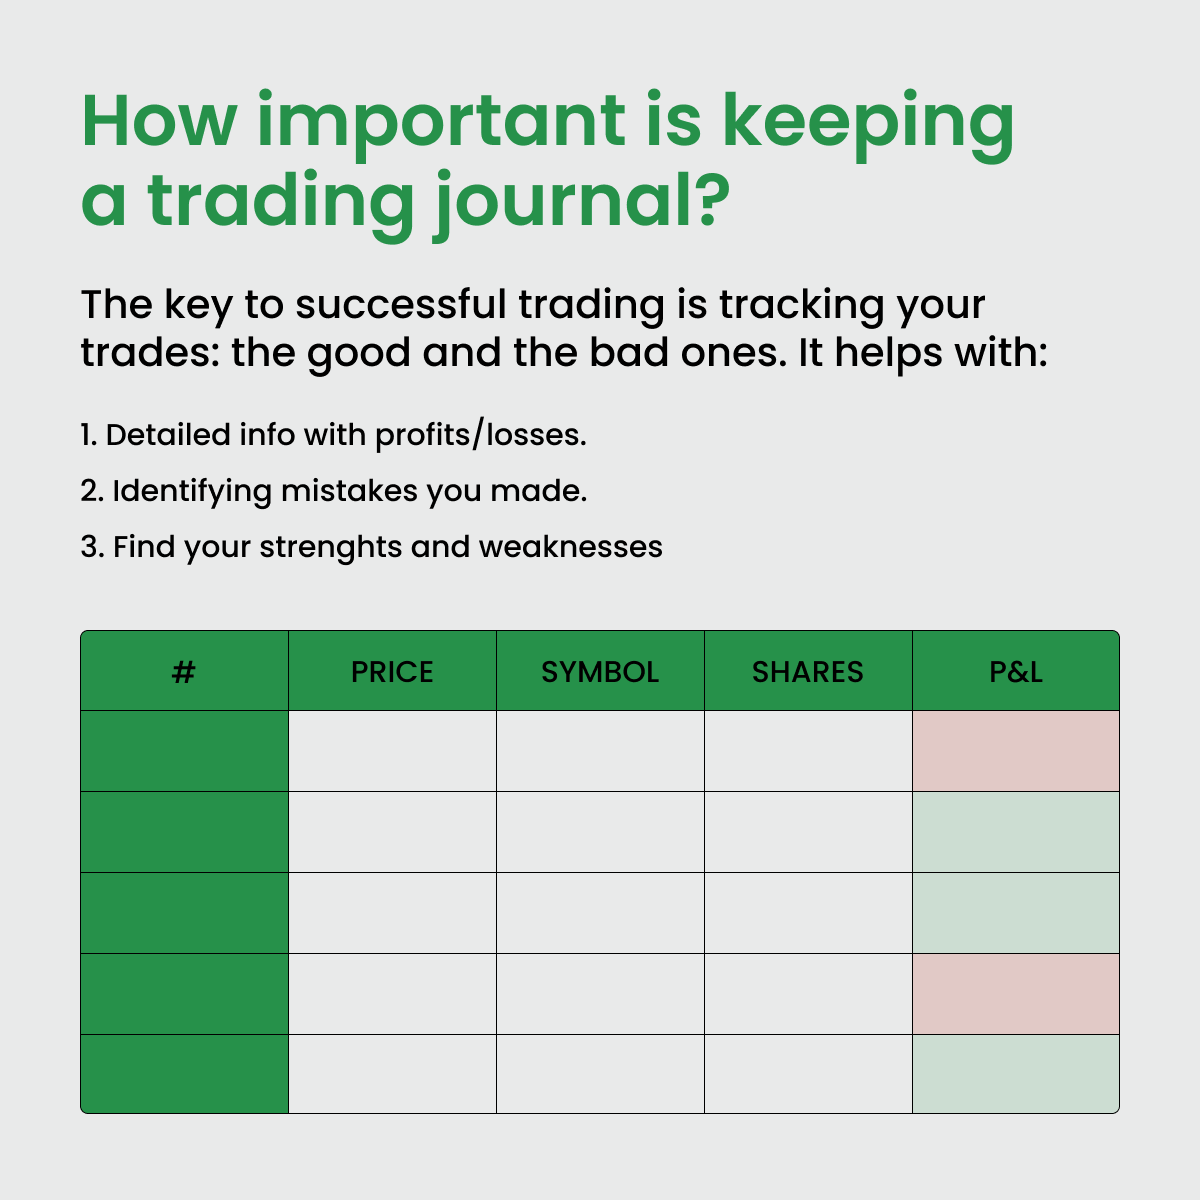
Apa itu jurnal perdagangan, dan bagaimana saya menggunakannya?
Jurnal perdagangan adalah satu lagi alat pendisiplinan diri yang saya gunakan selepas saya melaksanakan semua perdagangan saya. Ramai pedagang yang bijak mencipta templat untuk merekodkan semua urusniaga perdagangan mereka, baik yang untung mahupun yang rugi.
Langkah-langkah untuk menggunakan jurnal perdagangan dengan berkesan
Rekodkan setiap urusniaga perdagangan. Anda boleh menyusun data mengikut urutan tarikh, saiz lot, harga masuk, harga keluar, dan poin.
Catitkan tentang reaksi emosi anda. Walaupun ia pilihan bagi saya, mengakui impak emosi daripada urusniaga adalah penting, terutamanya jika emosi memainkan peranan dalam keputusan perdagangan.
Menganalisis kesudahan sesi perdagangan. Saya kerap menyemak kesudahan sesi saya untuk mengenal pasti daya pertumbuhan dan pola kejayaan dan kesilapan saya.
Melaras strategi. Langkah terakhir saya adalah untuk melaras suai dan memperbaiki strategi saya untuk hasil yang lebih baik.
Pro dan kontra jurnal perdagangan
Pro:
Analisis yang objektif
Alat pembelajaran untuk penambahbaikan kendiri
Kontra:
Memakan masa
Impak emosi
Walaupun ia datang dengan cabaran-cabarannya sendiri, dengan masa dan dedikasi perdagangan memberikan kita fakta, dan saya dapat mengenal pasti dengan jelas daya pertumbuhan saya walaupun kadang-kadang sukar untuk menghadapi kesilapan sendiri.
Tabiat buruk dan cara untuk menghentikannya
Beberapa kesilapan biasa dalam perdagangan boleh menjauhkan kita dari kejayaan dan keuntungan. Dengan FBS, saya telah menemui beberapa petua untuk mengelakkan kesilapan-kesilapan ini.
Terlebih berdagang (overtrading)
Maksud: Anda melaksanakan terlalu banyak urusniaga kerana membuat keputusan secara impulsif atau keinginan untuk memulihkan kerugian dengan cepat.
Impak: Kos transaksi meningkat, dedahan kepada risiko lebih tinggi, dan berpotensi letih dari segi emosi.
Cara mengatasi: Bina disiplin diri dengan merangka pelan perdagangan dan jangan berdagang lebih daripada yang anda rancang.
Kekurangan pengurusan risiko
Maksud: Anda mengelak daripada menerapkan strategi pengurusan risiko, terutamanya penggunaan pesanan renti rugi (stop loss).
Impak: Terdedah kepada kerugian dan tiada kawalan ke atas kesudahan perdagangan intrahari. Tiada kawalan ke atas kesudahan boleh membawa kepada kegagalan.
Cara mengatasi: Pesanan renti rugi adalah satu kemestian, jadi sentiasa tetapkannya sebelum anda membuka urusniaga perdagangan.
Tidak belajar dan mengkaji
Maksud: Anda tidak tahu tentang trend pasaran terkini, strategi perdagangan baharu, dan acara ekonomi yang berkaitan.
Impak: Terlepas peluang dan tidak berupaya untuk menyesuaikan diri dengan situasi pasaran yang berubah-ubah.
Cara mengatasi: Dapatkan maklumat terkini tentang perkembangan pasaran dengan mengikuti saluran media yang berkaitan, menyertai webinar pendidikan, atau membaca artikel.
Tips terakhir
Setelah apa yang saya kongsikan hari ini, saya mesti mengatakan bahawa ia berkesan untuk saya tetapi mungkin tidak berkesan untuk anda. Adalah penting untuk mendengar suara hati anda terlebih dahulu dan mencari apa yang paling sesuai untuk anda. Walau bagaimanapun, saya percaya disiplin adalah penting lebih dari sekadar dalam bidang perdagangan, dan anda juga boleh mengubah rutin anda untuk mencapai hasil yang terbaik dalam apa jua bidang.
Saya doakan agar semua pedagang berjaya mencapai kejayaan!
Ringkasan
Dalam dunia perdagangan yang dinamik, kejayaan bergantung pada rutin yang dirancang dengan baik. Berikut ialah contoh cara memperbaiki rutin anda daripada seorang pedagang intrahari yang berpengalaman: berdisiplin, catat jurnal, dan buang tabiat buruk.
Kembara dunia perdagangan ada cabaran-cabarannya sendiri. Malah pedagang yang paling berpengalaman dan terkenal sekali pun masih menghadapinya setiap hari. Di FBS, kami sedia membantu anda dalam menempuh kembara ini. Teruskan belajar, dan jumpa lagi pada lain kali.
FAQ
Apakah rutin harian yang sewajarnya untuk seorang pedagang?
Mulakan hari anda dengan menganalisis pasaran dengan membaca berita dan artikel berkaitan dan memantau rangka masa harian bagi instrumen-instrumen yang anda dagangkan.
Rancang strategi anda lebih awal – tuliskan matlamat anda dan tetapkan pesanan renti rugi dan ambilan untung.
Jangan lupa tentang acara ekonomi, kerana ia mempengaruhi harga dan boleh mengubah permainan.
Pastikan jurnal perdagangan anda dikemas kini dengan semua aksi anda semasa berdagang, kerana ia akan membantu anda melihat semua poin pertumbuhan untuk hasil yang lebih baik.
Apa yang dilakukan oleh pedagang intrahari yang berjaya?
Pedagang yang berjaya menunjukkan pelbagai tabiat dan amalan yang menyumbang kepada pencapaian mereka. Mereka berdagang dalam tempo masa sehari, membangunkan strategi yang berkesan, mengamalkan pengurusan risiko seperti pesanan renti rugi dan ambil untung, mengurus emosi mereka semasa berdagang setiap hari, dan menjejaki semua urusniaga mereka, baik yang rugi dan yang untung.
Apa yang lebih penting ialah menjaga gaya hidup agar seimbang untuk kejayaan yang berterusan. Pedagang intrahari, khususnya, harus mengutamakan kesihatan dan kesejahteraan mereka, mengakui bahawa kecergasan fizikal dan mental memberi kesan terhadap prestasi perdagangan mereka. Dengan memupuk gaya hidup yang sihat, mereka meningkatkan daya tahan mereka, kebolehan membuat keputusan, dan keberkesanan keseluruhan.
Apa yang dilakukan oleh pedagang dari hari ke hari?
Seorang pedagang yang berjaya tidak pernah berhenti belajar untuk mendapatkan hasil yang terbaik daripada perdagangan intrahari di pasaran Forex. Mereka mengikuti acara-acara ekonomi, memantau rangka masa harian (daily timeframe), dan mempelajari strategi baharu dari hari ke hari.
Apakah tabiat-tabiat baik pedagang yang berjaya?
Berikut adalah amalan utama yang boleh anda amalkan untuk memupuk gaya hidup pedagang Forex yang berkesan.
Membangunkan pelan perdagangan dengan satu set peraturan.
Jangan berdagang dengan membabi buta. Sebaliknya, tentukan semua titik masuk dan keluar anda dan tentukan sasaran keuntungan anda.
Uji strategi anda dengan menggunakan akaun demo.
Buat kajian dan belajar untuk memaksimumkan potensi anda.
Perdagangan melibatkan emosi-emosi yang negatif, jadi berwaspadalah dan jangan membuat keputusan yang tidak rasional.
Risikokan hanya apa yang anda mampu untuk lihat rugi dan sentiasa gunakan pesanan renti rugi. Kuncinya adalah memastikan kerugian-kerugian anda cukup kecil agar anda dapat mencari lebih banyak perdagangan yang berjaya.
Setiap pedagang, walaupun pedagang saham yang berjaya, pasti mengalami kerugian dalam perdagangan. Namun, pedagang yang bijak akan memastikan bahawa urusniaga yang rugi gagal dalam julat yang munasabah menurut pelan perdagangan mereka dan tidak menjejaskan modal untuk berdagang pada hari berikutnya.