Di manakah data CPI dapat ditemukan?
Harga pengguna membentuk sebahagian besar dari inflasi keseluruhan. Anda mungkin perasan kami menggunakan istilah “kadar inflasi” dan bukannya CPI dalam kalendar ekonomi. Istilah ini boleh ditukar ganti dan kedua-duanya merujuk kepada data yang sama.
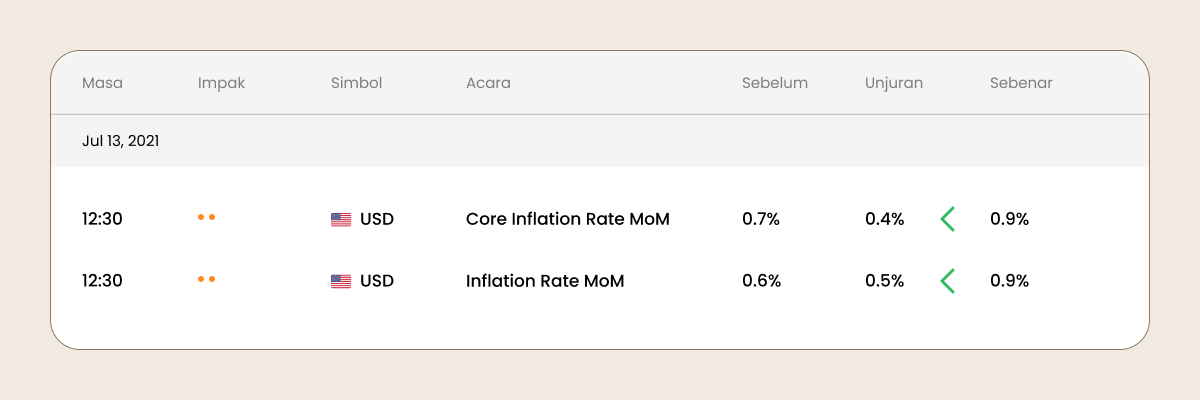
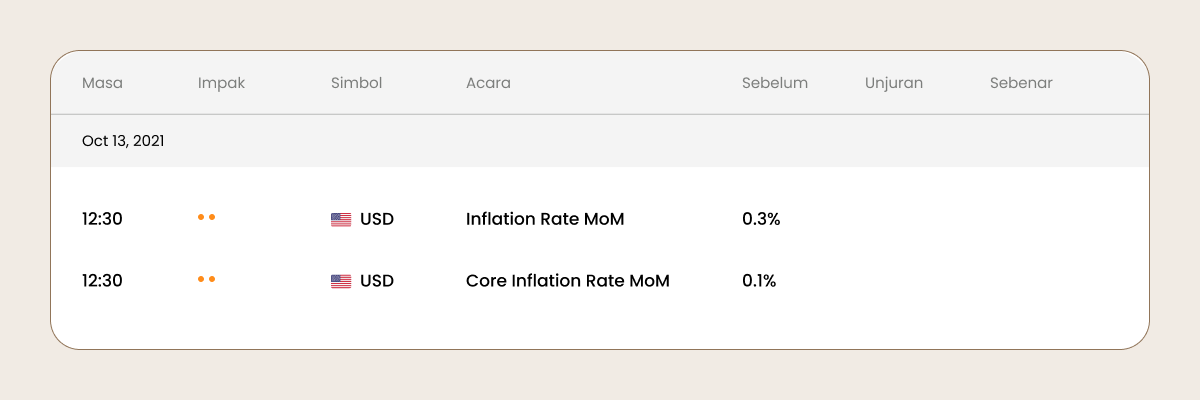
Terdapat dua versi laporan ini: kadar inflasi dan kadar inflasi teras. Perbezaannya mudah: indikator teras tidak memasukkan harga makanan dan tenaga dalam pengiraannya justeru kerana kemeruapannya yang tinggi.
Selain itu, terdapat indikator inflasi lain seperti indeks harga pengeluar (PPI), indeks harga borong (WPI), dan indeks harga runcit (RPI). Namun, CPI cenderung memberi impak yang lebih besar dari segi perdagangan forex.
Bagaimana CPI digunakan?
Seperti yang kami maklumkan, indeks harga pengguna ialah ukuran inflasi yang paling biasa. Ia memberi gambaran kepada kerajaan, syarikat, dan rakyat tentang perubahan harga dalam ekonomi negara mereka dalam satu tempoh tertentu. Berdasarkan CPI, peruncit meramalkan kenaikan harga pada masa hadapan, majikan membuat pengiraan gaji, dan kerajaan menentukan kenaikan kos sara hidup.
Apabila inflasi meningkat, kuasa beli menurun, bermakna pengguna boleh membeli lebih sedikit barangan dan perkhidmatan dengan harga yang sama dalam mata wang mereka berbanding sebelum ini. Apabila inflasi menurun, kuasa beli meningkat, dan pengguna boleh membeli lebih banyak barangan dan perkhidmatan dengan harga yang sama, yang bermaksud setiap unit matawang (contohnya satu dolar) lebih bernilai.
Paling relevan untuk trader, bank pusat membuat keputusan dasar berdasarkan indeks harga pengguna. Oleh itu, bukan sahaja data CPI sebenar, malah jangkaan pedagang terhadap pengumuman CPI akan meningkatkan kemeruapan di pasaran Forex.
Kenaikan harga boleh menyebabkan bank-bank pusat meningkatkan kadar faedah, yang akan menyebabkan kenaikan (peningkatan nilai) mata wang negara.
Sebaliknya, apabila inflasi menjadi terlalu rendah, bank pusat mungkin akan menurunkan kadar faedah, yang pasti akan membawa kepada penyusutan (penurunan nilai) matawang domestik.
Bagaimana CPI memberi impak terhadap perdagangan forex?
Pengumuman indeks harga pengguna cenderung menyebabkan pergerakan yang besar di pasaran forex. Harap maklum bahawa ia hanya merujuk kepada negara-negara dengan matawang yang cair.
Berdasarkan kecairan, terdapat tiga kategori matawang dalam perdagangan forex global: pasangan matawang major, pasangan matawang minor, dan matawang eksotik. Matawang major adalah yang paling popular dan cair. Ini termasuk dolar AS, pound British, euro, yen Jepun, dolar Australia, dan dolar Kanada. Oleh itu, lebih perhatian perlu diberikan terhadap pengumuman CPI AS, UK, Kanada, EU, Jepun, Australia, dan New Zealand.
Bagaimana cara berdagang dengan CPI
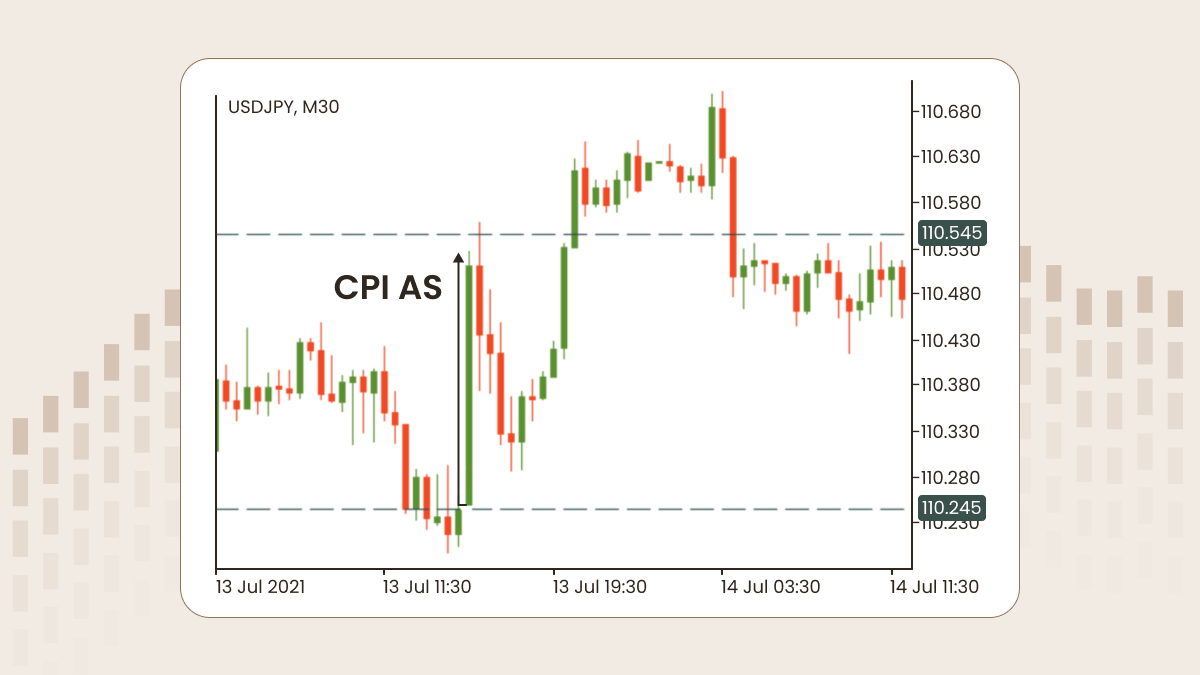
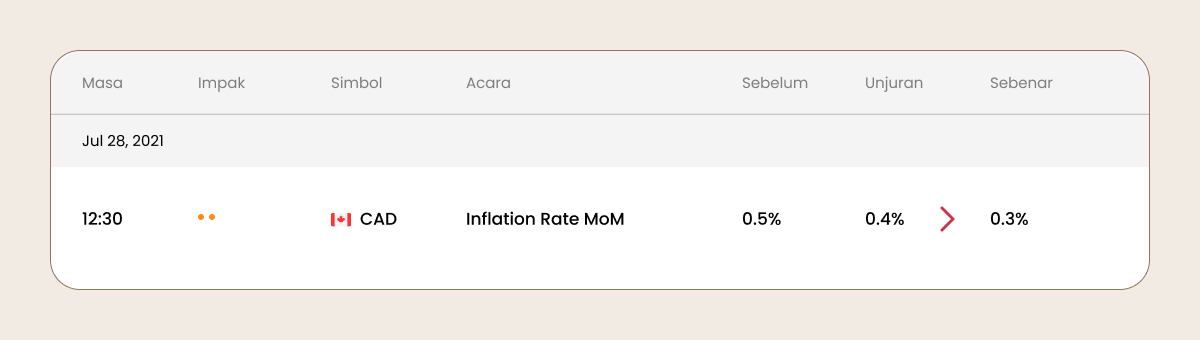
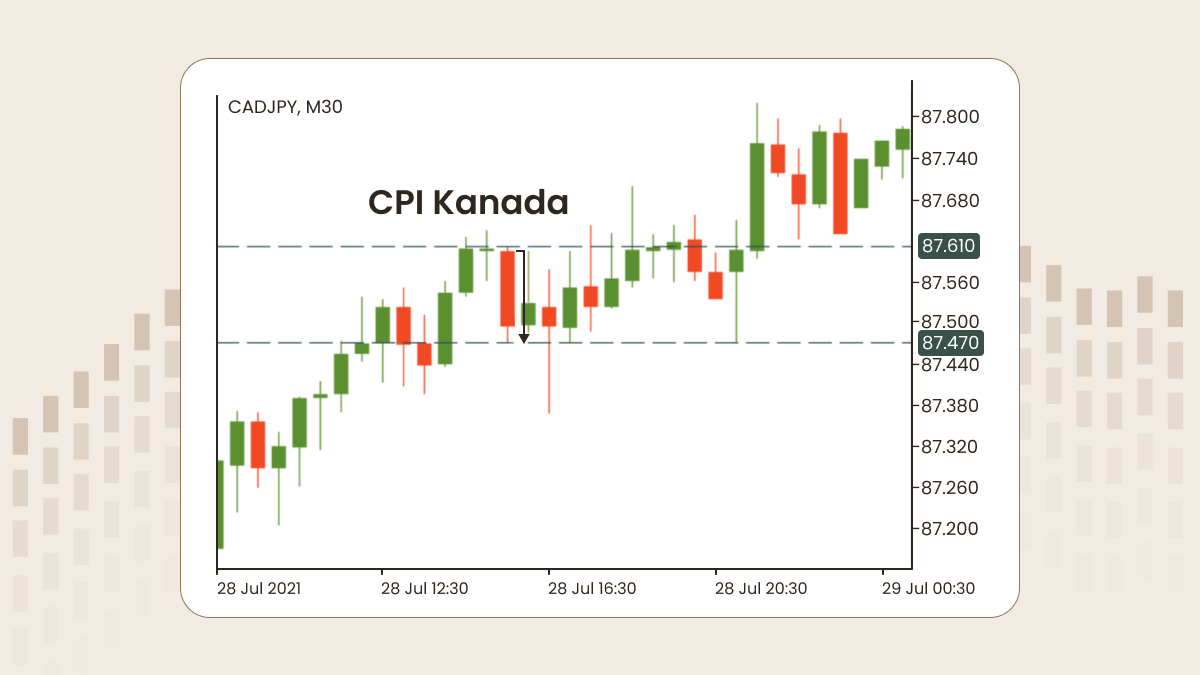
Pedagang membandingkan ramalan dengan data CPI sebenar, yang anda boleh semak dalam kalendar ekonomi.
Jika data sebenar CPI lebih besar dari jangkaan, matawang berkaitan akan meningkat.
Jika data sebenar CPI lebih rendah dari yang diunjurankan, matawang berkaitan akan melemah.
Sebaiknya semak masa pengumuman CPI yang seterusnya terlebih dahulu, buka carta yang menunjukkan matawang negara yang mengeluarkan CPI, dan pantau pergerakan harga. Dengan cara itu, sebaik sahaja ia diumumkan, anda akan bersedia sepenuhnya, ibarat jari sudah di picu.
Bagaimana dengan pasaran saham? Adakah ia terjejas oleh CPI? Pasaran saham secara amnya tidak dipengaruhi oleh angka CPI, tetapi kadangkala ia boleh berlaku! Inflasi yang lebih tinggi dan seterusnya kadar faedah yang meningkat boleh menyebabkan kelembapan dalam aktiviti ekonomi. Oleh itu, sebagai peraturan, pasaran saham memihak kepada CPI yang lebih rendah, yang membolehkan pengguna terus berbelanja dan perniagaan terus melabur dengan lebih banyak lagi.
Jika konsep CPI dirasakan agak abstrak, jangan risau! Semuanya mula jelas sebaik sahaja anda menguasai asas dalam berdagang. Kursus permulaan kami menghuraikan dengan cara yang praktikal, supaya anda boleh mengaitkan data ekonomi seperti CPI kepada keputusan perdagangan sebenar.