Analisis Fundamental: Inflasi UK dan Jangkaan Dasar Monetari
Poin-poin utama:
- Inflasi UK yang lari dari sasaran (2.8% YoY) memberi tekanan kepada GBP, tetapi inflasi perkhidmatan yang liat untuk berubah (5%) membantutkan jangkaan pemotongan kadar BoE.
- Dasar fiskal menjadi perhatian: pemotongan perbelanjaan dalam Penyata Musim Bunga UK boleh merencat pertumbuhan, menjadikan GBP rentan.
- USD kekal berdaya tahan walaupun terdapat risiko tarif, dengan data PCE sebagai pemangkin seterusnya.
- Aras teknikal kritikal: 1.2850 (sokongan) dan 1.2950 (rintangan). Penembusan akan menentukan arah trajektori jangka pendek.
- Amaran risiko: Perbezaan dasar monetari (BoE vs. Fed) dan geopolitik merangsang kemeruapan.
Paun British (GBP) berhadapan dengan tekanan bearish pada hari Rabu ini berikutan data inflasi UK yang lebih lemah daripada jangkaan. Indeks Harga Pengguna (CPI) tahunan bulan Februari diumum 2.8%, di bawah unjuran 2.9% dan bacaan 3.0% pada bulan Januari. Inflasi teras (tidak termasuk item yang harganya meruap) juga susut kepada 3.5%, menguatkan jangkaan pengurangan kadar oleh Bank of England (BoE) dalam beberapa bulan mendatang. Walau bagaimanapun, inflasi perkhidmatan—metrik utama BoE—kekal pada paras 5%, berpotensi melambatkan pelonggaran monetari yang agresif.
Pendorong Jangka Pendek Utama
Fokus pasaran kini beralih kepada Penyata Musim Bunga. Canselor UK, Rachel Reeves, dijangka akan mengumumkan beberapa langkah fiskal termasuk pemotongan bantuan kebajikan dan peningkatan perbelanjaan pertahanan sebanyak £2.2 bilion. Pengetatan fiskal yang sederhana boleh merencat pertumbuhan ekonomi dan membuatkan GBP terus suram. Sementara itu, US Dollar (USD) menunjukkan daya tahan walaupun terdapat ketidakpastian mengenai tarif-tarif Donald Trump (tarikh akhir 2 April), mendorong pasangan ini lebih meruap.
Prospek USD
Data PCE Teras AS pada hari Jumaat (ukuran inflasi yang disukai Fed) adalah data yang kritikal. Angka yang tidak berubah (unjuran: 2.7% YoY) mampu menguatkan USD lebih lanjut, manakala gerakan menurun di luar dugaan boleh menghidupkan selera risiko dan melegakan tekanan GBP buat sementara.
Analisis Teknikal | GBPUSD, H4
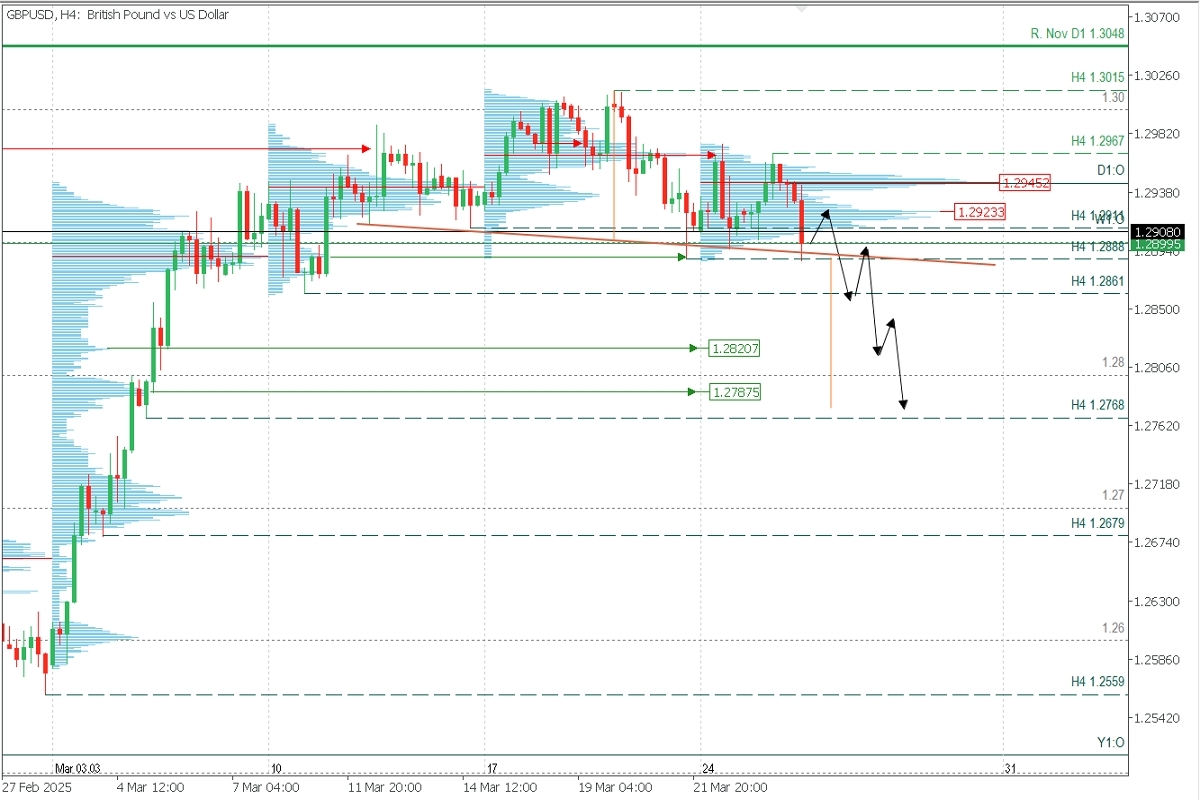
Zon Bekalan (Jual): 1.2945 || Zon Permintaan (Beli): 1.2820 / 1.2787
Sesi dibuka dengan harga merosot -0.40% setelah data CPI Februari UK diumum dengan angka yang mengecewakan. Ini telah mengaktifkan pola penyongsangan Head and Shoulder, dengan neckline yang condong menurun menunjukkan tekanan bearish yang semakin kuat.
Struktur teknikal bullish dicabar oleh penembusan ke bawah aras sokongan utama H4 di 1.2911 sebanyak dua kali berturut-turut. Paras terendah terbaru ini menjadikan 1.2967 aras rintangan H4 yang terakhir disahkan, yang kini berfungsi sebagai aras rujukan untuk mengekalkan kecenderungan bearish kecuali jika ditembusi dengan jelas dan nyata.
Dalam konteks ini, kami menjangka akan berlaku pergerakan menurun lebih lanjut selepas pullback ke arah 1.2927-1.2930, lokasi di mana tekanan jual yang baru mungkin akan muncul. Sasaran sejajar dengan zon permintaan bervolum tinggi di 1.2820 dan 1.2787, yang juga sepadan dengan unjuran pergerakan yang diukur pada pola penyongsangan.
Senario Trading:
- Bearish: Tunggu pembeli menolak harga naik ke 1.2927, kemudian jual di bawahnya, mensasarkan 1.2861, 1.2820, 1.2800, dan 1.2787.
- Bullish: Hanya di atas 1.2787, mensasarkan 1.2860.
Syarat Pembatalan: Senario penyongsangan menjadi tidak sah jika harga secara tegas menembus ke sebelah atas 1.2945 POC (Titik Kawalan) dan rintangan 1.2967.
Nota Kritikal:
Pola Reversal/Exhaustion (PAR): Sentiasa nantikan pengesahan pada rangka masa M5 (contohnya, bar pin atau pola menelan) sebelum membuka posisi pada aras-aras utama.
Kepentingan POC: Point of Control menandakan kepadatan volum tertinggi. Jika harga sebelum ini jatuh daripada zon ini, ia bertindak sebagai rintangan; jika ia berarak naik, ia akan menjadi sokongan.
Unjuran teknikal ini kekal sah melainkan pemangkin fundamental (contoh, data PCE AS) mengatasi aksi harga.
@2x.png?format=webp&quality=90)


