US500, H4

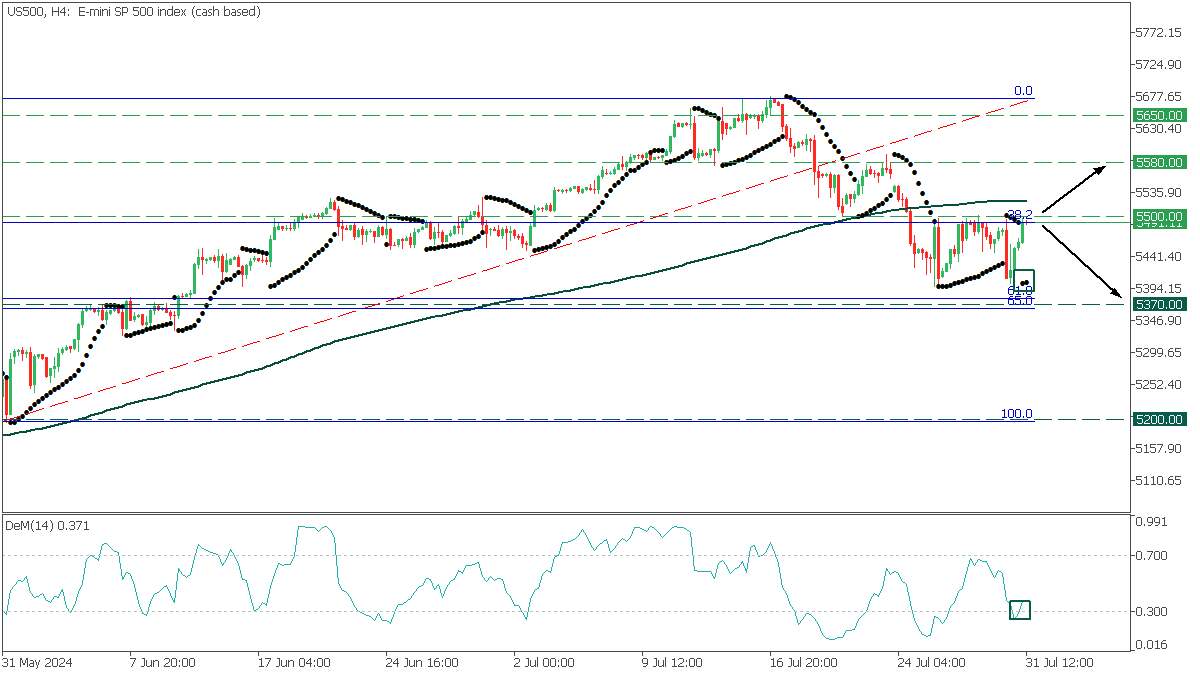
On the H4, US500 tests the crucial resistance zone at the 5500 level, aligned with the 38.2 Fibonacci ratio. The parabolic SAR pointed below the candle and started rising, while the DeMarker oscillator breached above the oversold zone, giving us a bullish sentiment.
- If the price breaks above the 5500 resistance, it could rise to 5580;
- Conversely, a corrective rebound from the 38.2 Fibonacci will trigger a decline to 5370.
