USDCAD, Daily
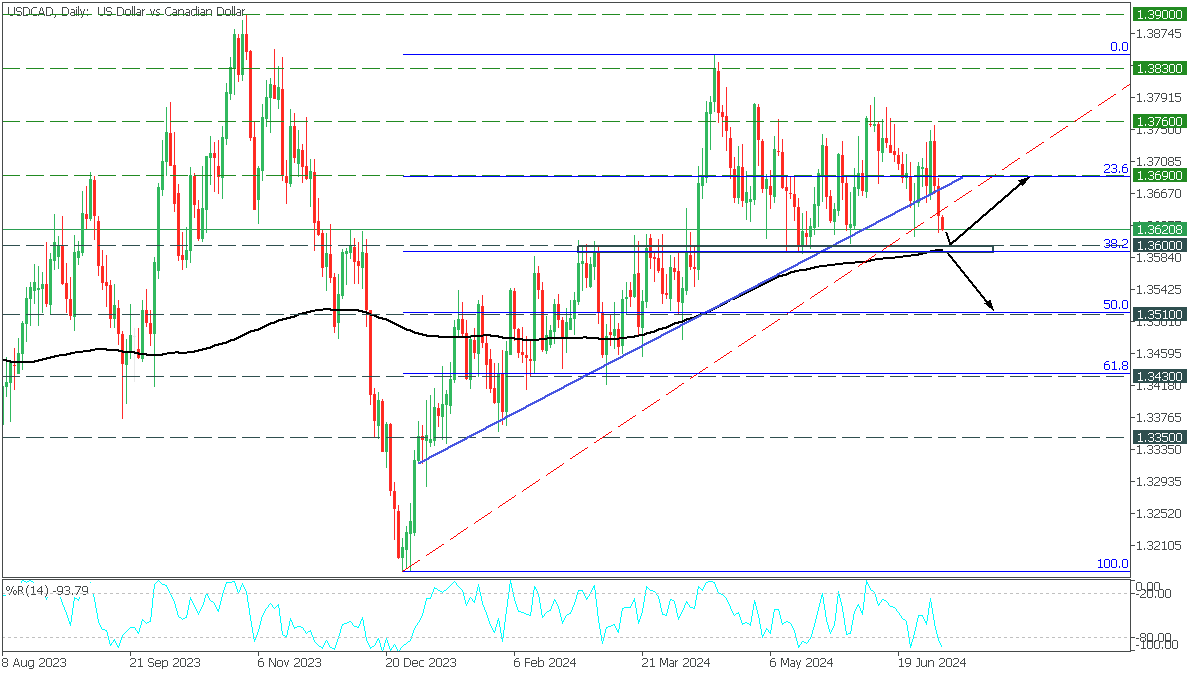
In the Daily timeframe, USDCAD broke the trend line after a long-term rise. The price is aimed at the 38.2 Fibonacci support area for the MA200. Despite the trendline breakout, the %R indicates a significant oversold condition, which could create two possible scenarios.
- If price breaks 1.3600 and MA200, the decline will continue to 1.3510;
- If USDCAD bounces off the support, it could recover to 1.3690;