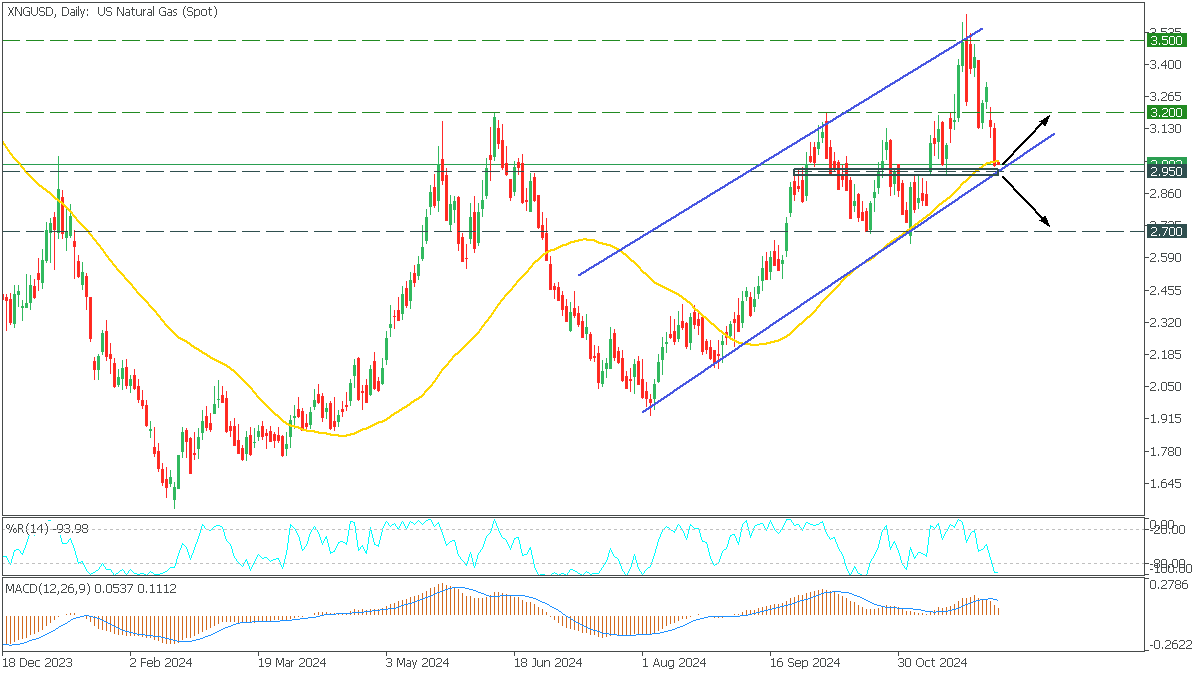
XNGUSD, Daily

In the Daily timeframe, XNGUSD formed an ascending channel pattern. The price fell to the lower trend line, testing the support and MA50. Indicators give mixed signals: MACD indicates the possibility of a further decline, while %R shows a significant oversold condition.
- If the price breaks the trend line below 2.950 and MA50, it will start a bearish trend to 2.700;
- A rebound from the trend line will bring the price back to 3.200;
