AUD/USD: another downswing in the row
Long-term
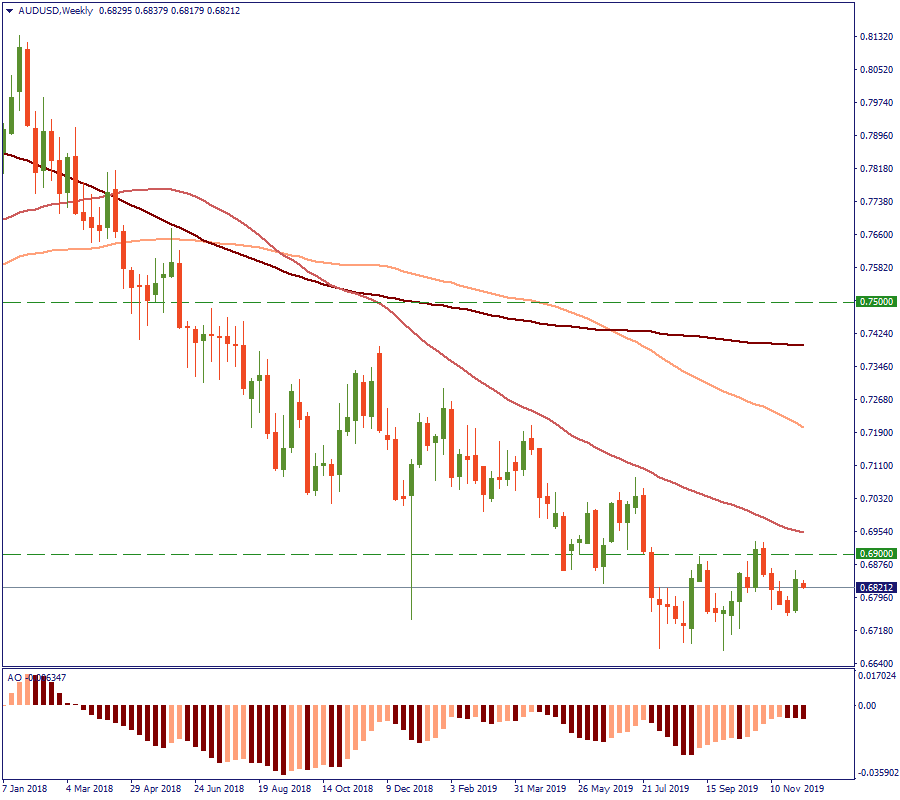
Since May 2018, when the price of AUD against the USD crossed the level of 0.7500, the long-term trend of the currency pair has been going downwards. The closer to the current moment, the more it has been confirming the decline: since June 2019, the 200-week, 100-week and 50-week Moving Averages are in the negative order, with 50-week MA being a resistance. Therefore, in the long-term, the price is likely to continue this direction unless there are strategic factors revealed that would change the setting. In any case, the price will have to struggle its way upwards in case the market reversal starts looming in the currency horizon. On the weekly chart, the resistance of 0.6900 would be a good checkpoint for that as it marks the previous high, and since the end of 2018, the price has never broken a previously reached distinctive high.
Short-term
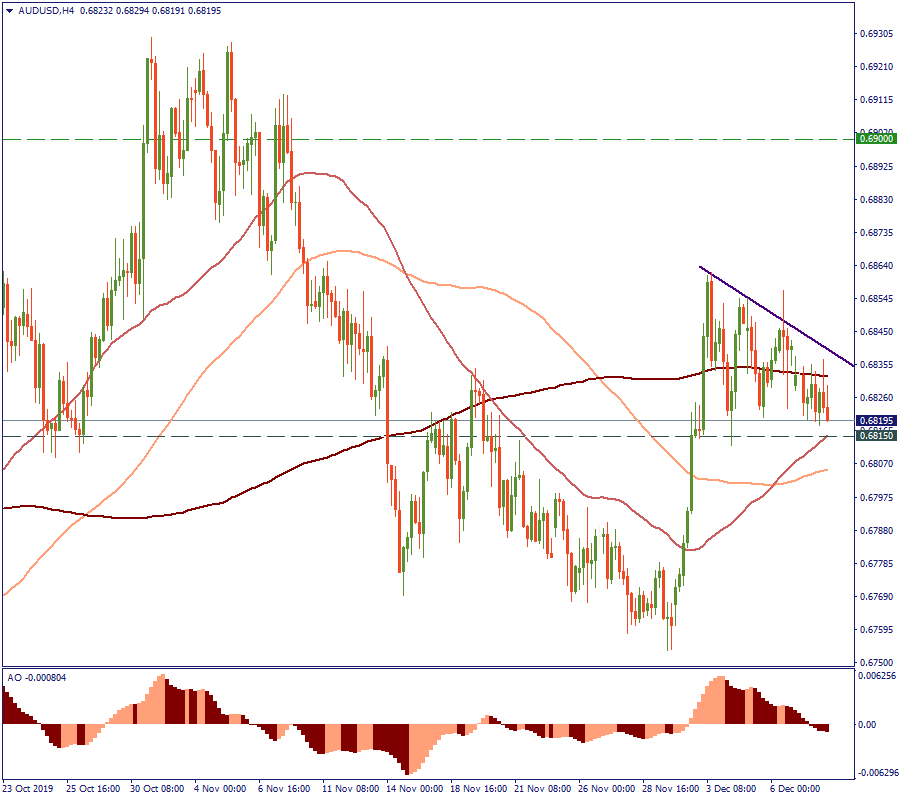
On the H4, AUD/USD is testing the support of the 50-period MA, which is at the level of 0.6815. In fact, it has been consolidating right above this level in a gradually decreasing magnitude of price action since the beginning of December. Now, if the price breaks this support on the way down, that will be a solid proof that the recent high area has completed forming and that the market is going to move down in a more decisive way. Awesome Oscillator has already crossed the zero line, which gives the same interpretation. Altogether, if there is no new incoming information altering the market setting, we are likely to observe another cascade down today and tomorrow.