EUR/GBP Technical Analysis
EUR/GBP Technical Analysis
The Backdrop
The EUR/GBP pair has been steadily rising since May 6th as the uncertain political backdrop inside the United Kingdom continued to hurt the trading sentiment towards the British pound currency. The traditionally slow-moving currency pair turned technically bullish after breaking above its 200-day moving average, May 22nd.
Since firming above its 200-day moving average the EUR/GBP pair found advanced to its highest trading level since January 16th this year and eventually met strong technical resistance from the 0.8874 level towards the end of last week.
Technical Outlook
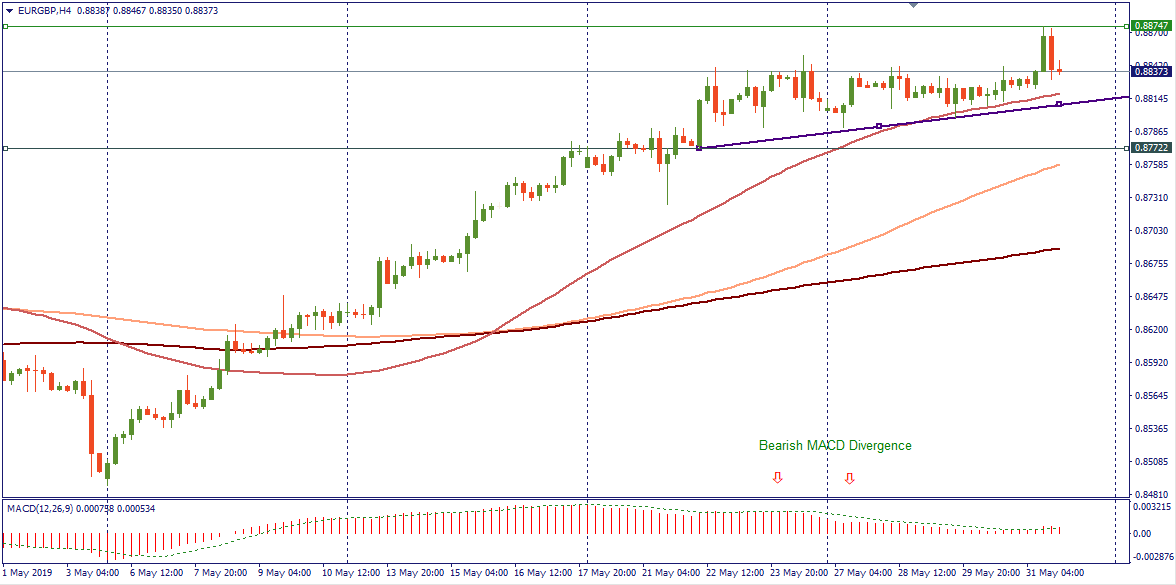
H4 Time Frame
The four-hour time frame is currently showing the presence of bearish MACD price divergence, which currently extends down towards the 0.8772 level. The large bearish reversal candle on the four-hour time frame suggests we may now be seeing this bearish divergence starting to be reversed.
Traders should also consider the EUR/GBP pair’s 200-period moving average on the four-hour time frame around the 0.8687 level. Price has traded above the 200-period MA since early May, sustained weakness below the 0.8772 may signal additional near-term weakness, with the 200-period average the major support level to watch on the four-hour time frame EUR/GBP pair.
Daily Time Frame
The daily time frame is showing that a possible inverted head and shoulders pattern is taking shape, with the EUR/GBP pair now testing the neckline of the pattern around the 0.8839 level. The bullish pattern has an upside projection of just under four hundred pips. Trader should expect the pair to hold a strong short-term bullish bias while price continues to trade above the 0.8839 level.
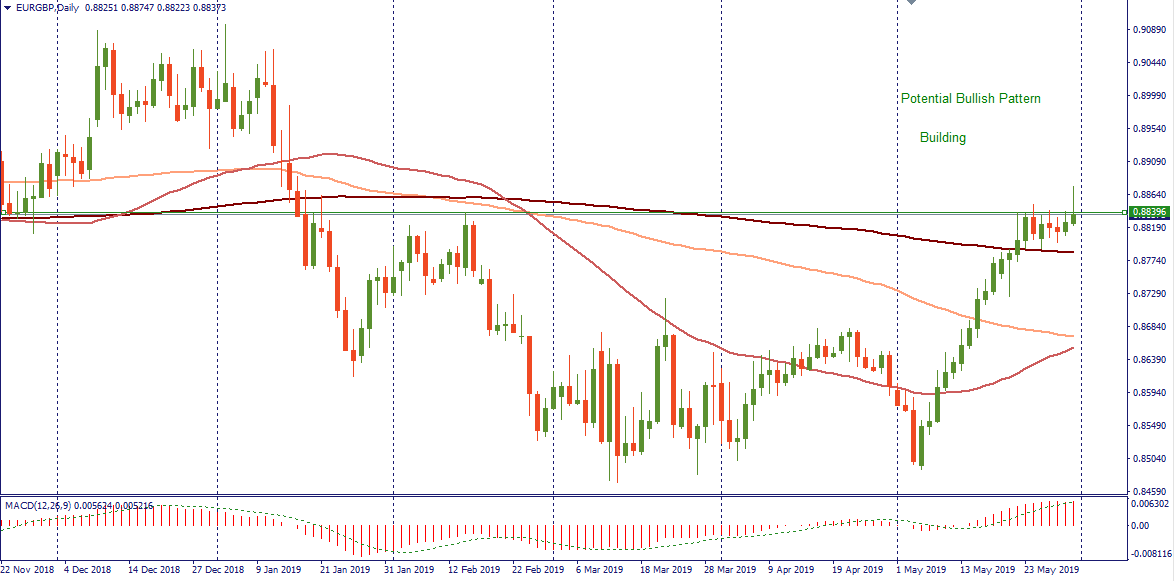
Key technical resistance above the May monthly trading high is found at the January 15th swing-high, at 0.8985, and the January 3rd swing-high, at 0.9096. To the downside, the EUR/GBP pair’s 200-day moving average, at 0.8785, is the most prominent technical support level to watch if sellers start to take control of price. Key support below comes from the 100-day and 50-day moving averages, at 0.8671 and 0.8655.