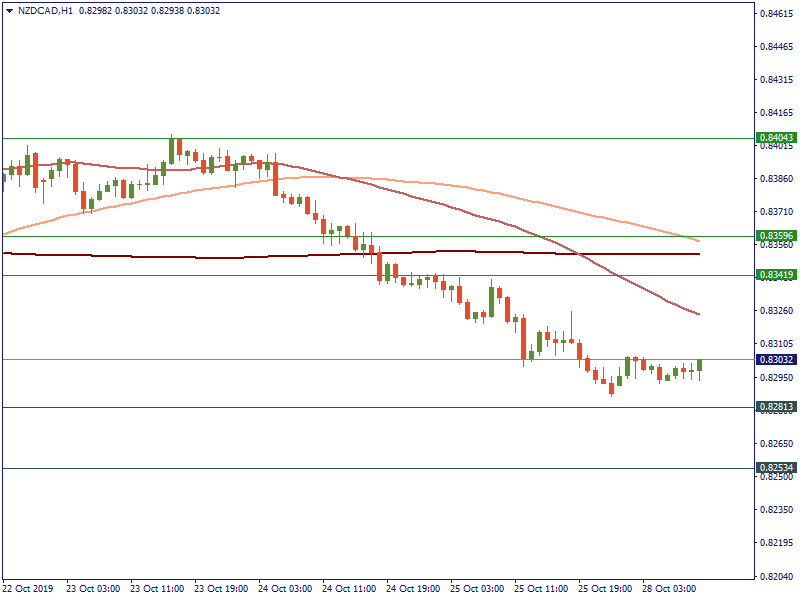
NZD/CAD is continuing downward movement
Baca artikel ini di laman web FBS
On the H1 chart of NZD/CAD, the price once again bounced back from the local resistance level of 0.8404 and is on the way down to support at 0.8281. 50-period MA is already below 200-period MA, with 100-period MA also dropping. This should mean that NZD/CAD most probably will break through the nearest support level to the next support at 0.8253. If the movement gets back up into the bullish trend, the resistance levels are at 0.8342, 0.8359 and 0.8404.