NZD/USD: triangle forming
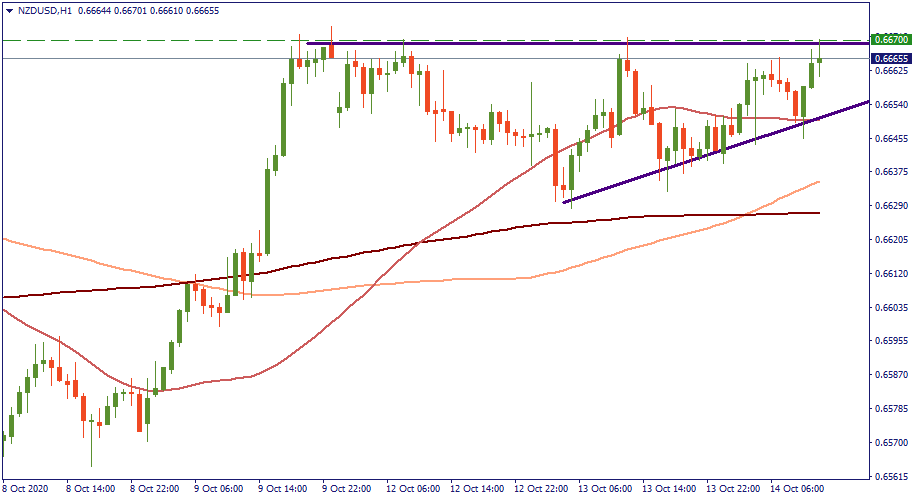
On the H1 chart of NZD/USD, you will see the resistance of 0.6670 that has never been breached since October 9. It will, eventually, and the question is when.
The higher lows from the last two days suggest that the bullish pressure is increasing from the downside and may finally erupt in the coming days. Take October 12 as the beginning of the triangle’s side and drag it forward until it converges with the upper side at 0.6670 like in the chart. The convergence point appears to be on October 15 – meaning, on Thursday. That suggests that before breaking the resistance, the pair will make another wave down to make another higher low above the 50-MA, and after that will aim to break the roof at 0.6670.
By the way, here is a video on trading triangles - enjoy!