The Oil Market in the Month of June
Thanks to the incredible advancements in horizontal drilling and fracking technology, the United States has experienced a mind-blowing shale revolution. They've become the heavyweight champion of crude oil production, leaving Saudi Arabia and Russia in the dust. They even turned the tables and became net exporters of refined petroleum products in 2011. Talk about a plot twist! This seismic shift has made the U.S. about 90% self-sufficient in energy consumption, according to the Energy Information Administration. As U.S. oil exports soar, oil imports take a nosedive, which not only helps decrease the trade deficit but also throws the historically strong relationship between oil prices and the U.S. dollar off balance. Buckle up, folks! The oil market is full of surprises. Happy trading!
US Dollar - Daily Timeframe
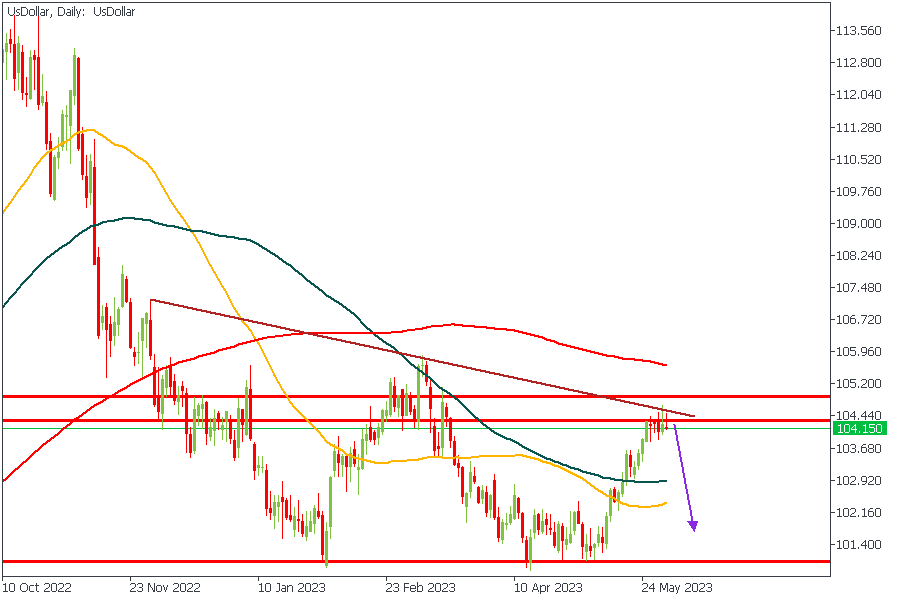
The US Dollar on the daily timeframe has finally given the first signs of a rejection from the supply zone as highlighted above. The additional confluence from the resistance trendline and the descending array of the moving averages seems to lend even more credence to the possibility of a bearish price action on the US Dollar chart.
Analyst’s Expectations:
Direction: Bearish
Target: 102.75
Invalidation: 104.71
XTIUSD - Daily Timeframe
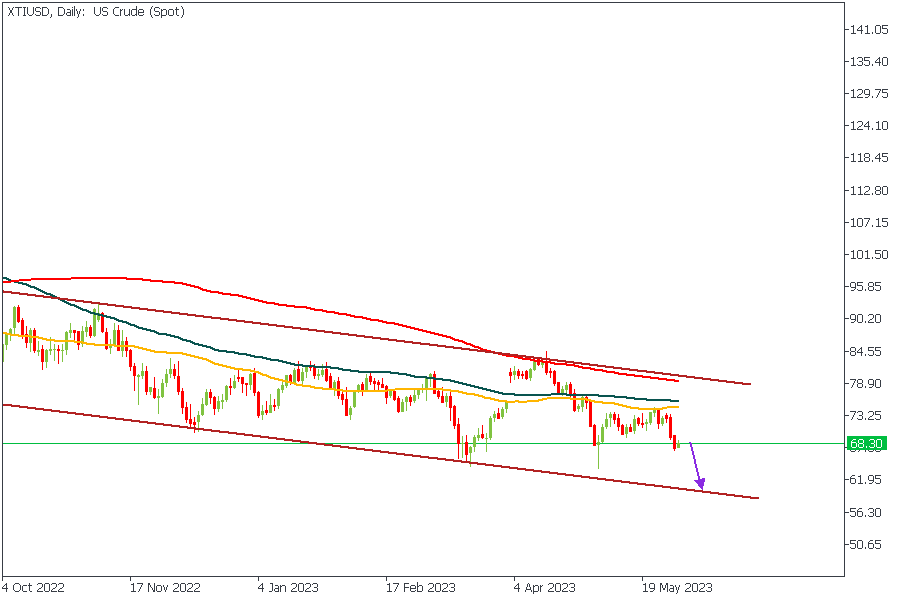
As I earlier explained in the first paragraph, the relationship between the value of the Dollar and the price of Oil has seen some drastic changes in recent times. This indicates the possibility of a positive correlation between both commodities. Based on the price action of US Crude trading within the descending channel, and the bearish array of the moving averages, I believe we should get to see XTIUSD drop even further.
Analyst’s Expectations:
Direction: Bearish
Target: 63.28
Invalidation: 74.49
XBRUSD - Daily Timeframe
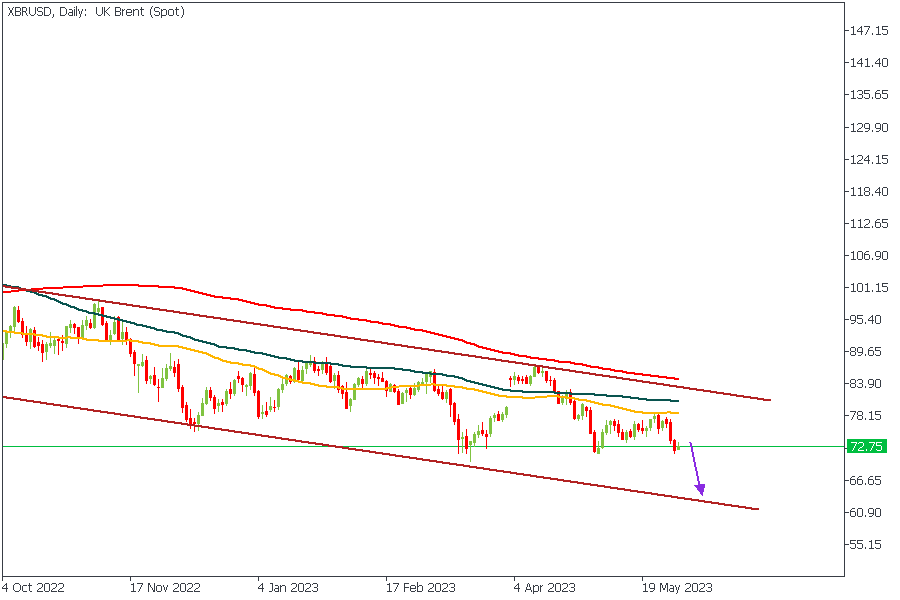
Brent may yet continue on its bearish rally due to the confluence of the descending channel and the bearish moving average array. The latest rejection on XBRUSD also seems to have happened from the 50-Day average. I, therefore, expect to see a continued bearish price action until the trendline support is reached.
Analyst’s Expectations:
Direction: Bearish
Target: 66.73
Invalidation: 78.43
CONCLUSION
The trading of CFDs comes at a risk. Thus, to succeed, you have to manage risks properly. To avoid costly mistakes while you look to trade these opportunities, be sure to do your due diligence and manage your risk appropriately.
You can access more of such trade ideas and prompt market updates on the telegram channel.