USD/RUB: technical long term
Currently, one USD dollar costs approximately 70 Russian rubles.
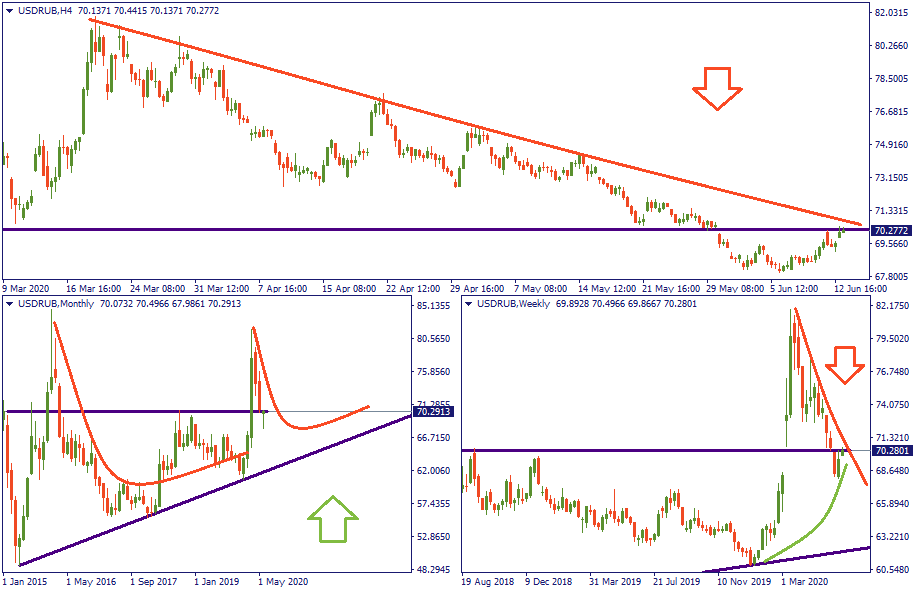
The latest bullish episode doesn’t change the fact that the mid-term tendency is still bearish. Why? A strategic perspective explains that pretty well. The USD/RUB relationship is quite sensitive to oil crises as we have explained before – in fact, that is almost the only factor that may abruptly push USD/RUB away from its “default” trajectory. The latter is dictated by the global superiority of the US economy against Russian economic weakness that logically results in the appreciation of the USD.
That’s why the strategic lowest lows (as in the monthly chart below) keep lining up in a straight line with positive inclination. While the highest highs make USD/RUB eventually bounce and slide down, it inevitably gets back into the upward trajectory. In the meantime, 70 is the level at which USD/CAD finds itself at equilibrium. For this reason, regardless of the short-term picture, in the nearest future, we are going to see USD/RUB circle around the level of 70. But when the long-term trajectory comes to test this level, we are likely to see another gradual rise followed by possible another surge.