

Instrumen Minggu Ini (25-29 Mac): Spotlight GBPCAD
Ketahui mengapa FBS mengurangkan spread GBPCAD dan apa yang perlu dilakukan seterusnya!
2024-03-22 • Dikemaskini
Canadian retail sales showed a slight rebound in February, rising by 0.1% after a 0.3% drop in January. However, this failed to fully offset the steeper decline earlier in the year, suggesting a weakening momentum in consumer spending. The increase in February was driven by gains in sectors such as sporting goods, hobby retailers, and building materials. Despite the improvement, ongoing challenges in retail sales growth, coupled with easing price pressures and a cooling job market, may prompt policymakers to consider adopting easier monetary policy in the coming months. However, there is little evidence of a sharp decline in retail activity that would urgently necessitate a rate cut by the Bank of Canada.
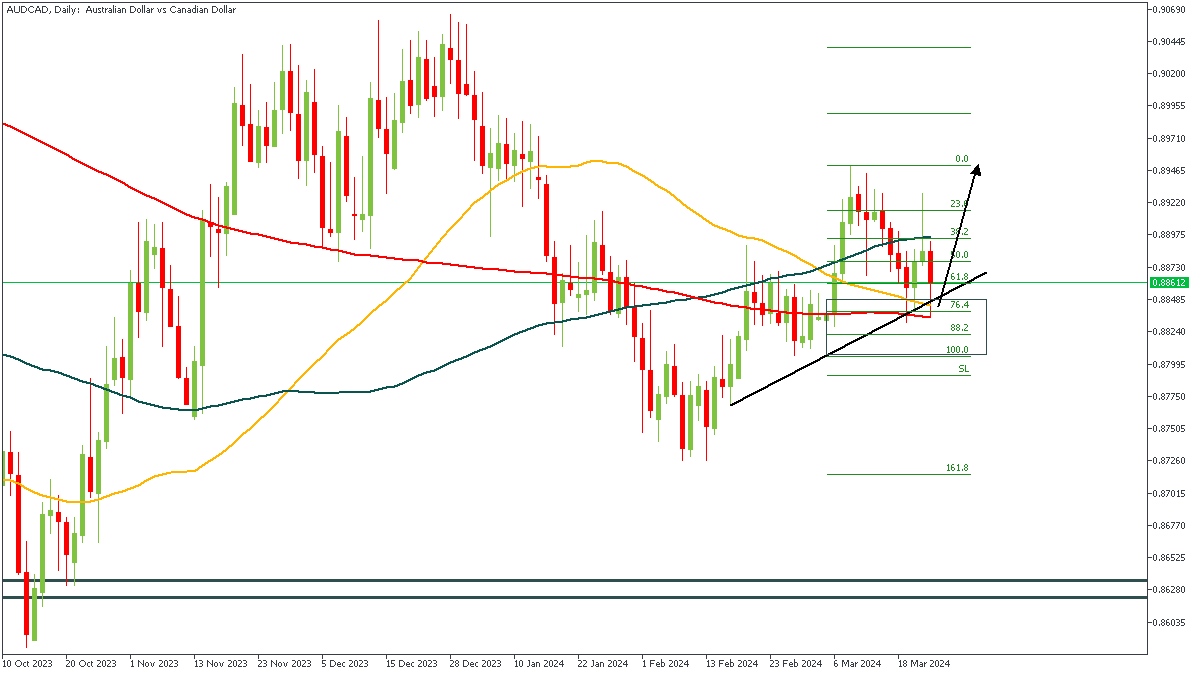
After breaking above the previous high on the daily timeframe, we’ve seen the price action on AUDCAD’s charts gradually slip back down to complete a retest of the drop-base-rally demand zone. In order to complete this execution, I have plotted a Fibonacci retracement tool, which shows me that the trendline support, and the moving average supports are all confirmations of my bullish sentiment.
Analyst’s Expectations:
Direction: Bullish
Target: 0.89154
Invalidation: 0.88040
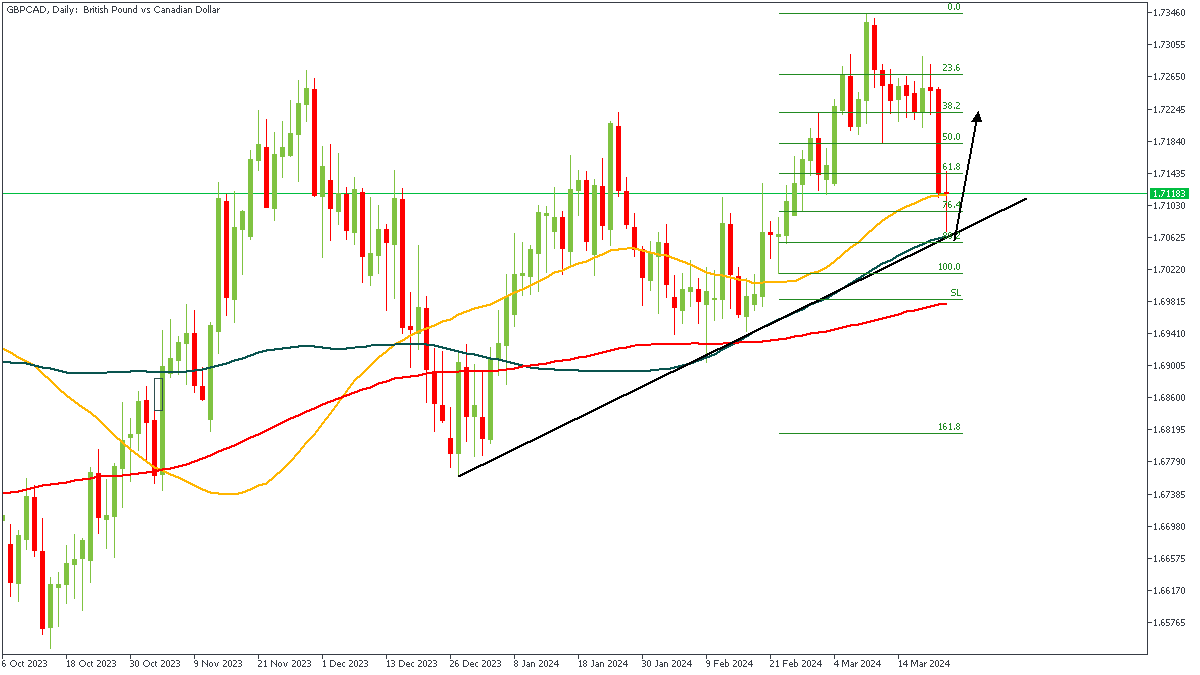
The price action on GBPCAD replays a textbook break-and-retest pattern; following the break above the previous high, we’ve seen price retest the demand zone as well as the trendline support - with a little help from the Fibonacci retracement level, and the moving average support. Clearly, the bullish array of the moving averages pretty much confirms a bullish sentiment to be factual.
Analyst’s Expectations:
Direction: Bullish
Target: 1.72204
Invalidation:1.70146
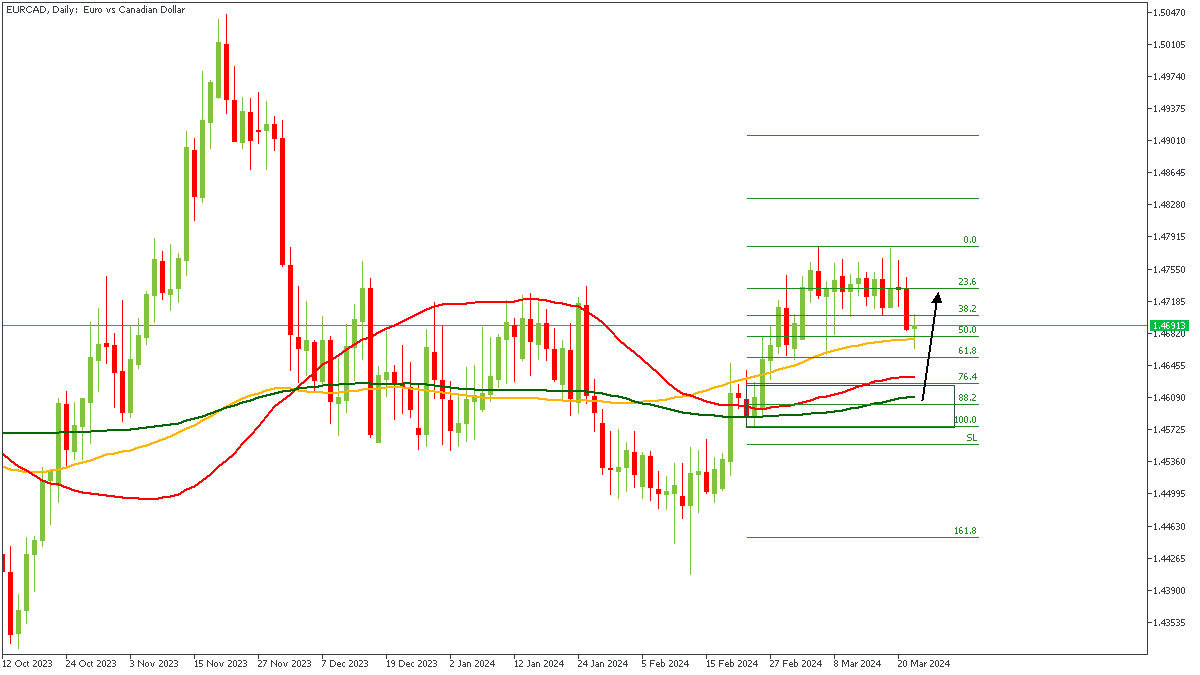
Here again we see the same pattern play out on the daily timeframe of EURCAD; we clearly see the uptrend as indicated by the break above the previous high, with the 50 and 200 period moving averages serving as support areas for the price action at the moment. Combining this with the drop-base-rally demand zone and the Fibonacci retracement levels, I think it’s safe to anticipate bullish price action from that region.
Analyst’s Expectations:
Direction: Bullish
Target: 1.47286
Invalidation: 1.45723
The trading of CFDs comes at a risk. Thus, to succeed, you have to manage risks properly. To avoid costly mistakes while you look to trade these opportunities, be sure to do your due diligence and manage your risk appropriately.
You can access more of such trade ideas and prompt market updates on the telegram channel.

Ketahui mengapa FBS mengurangkan spread GBPCAD dan apa yang perlu dilakukan seterusnya!

Kenaikan hara yang berlaku itu adalah sebelum mesyuarat FOMC di mana harga berjaya capai ketinggian 1…

Pengaruh dolar sebagai matawang rizab dunia telah merosot secara beransur-ansur. Adakah mungkin untuk euro menggantikannya? Kami juga tidak pasti tentang perkara itu.

Fed mengumumkan pada hari Rabu bahawa ia membiarkan kadar dasar tidak berubah pada 5…

Jepun melangkah lebih dekat kepada campur tangan mata wang dengan amaran terkuatnya apabila yen merosot ke paras paling lemah dalam kira-kira 34 tahun berbanding dolar…

Sentimen pasaran yang memulih pada pembukaan dagangan awal minggu semalam telah menukar semula haluan pergerakan USD…
FBS menyimpan rekod data anda untuk mengoperasikan laman web ini. Dengan menekan butang "Terima", anda menyetujui Polisi Privasi kami.
Permohonan anda telah diterima
Pengurus akan menghubungi anda dalam amsa terdekat
Permohonan panggil balik seterusnya untuk nombor telefon ini
boleh dilakukan dalam dalam
Jika anda mempunyai isu yang perlu disegerakan, sila hubungi kami menerusi
Live Chat
Masalah dalaman. Sila cuba sebentar lagi
Jangan bazir masa anda – pantau bagaimana NFP mempengaruhi dolar AS dan kaut keuntungan!
|


